Working with Geospatial Data in Python
Dani Arribas-Bel
Geographic Data Science Lab (University of Liverpool)
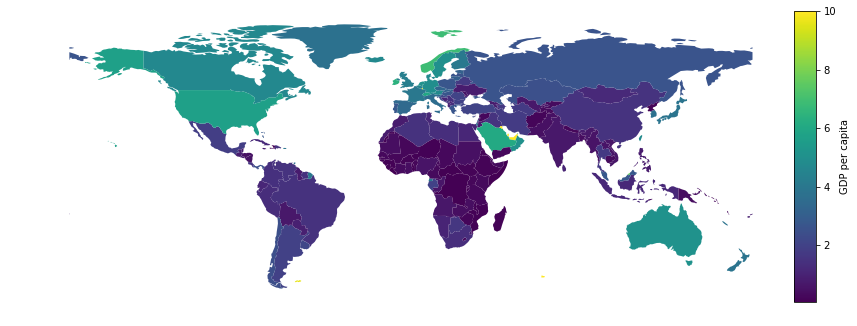
countries.plot(column='gdp_per_cap', legend=True)
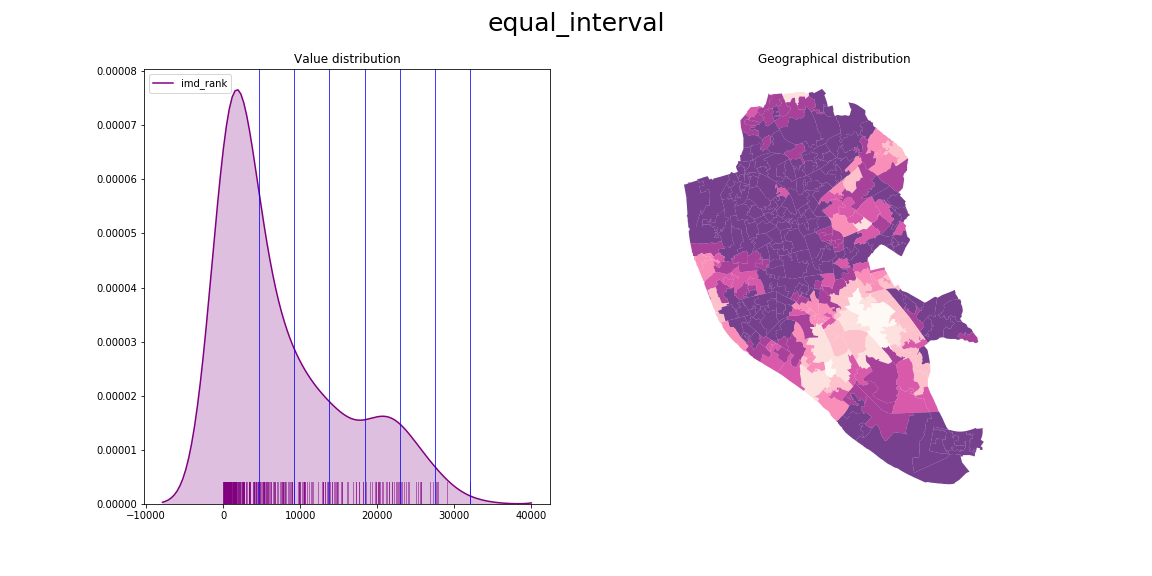
Specifying a column:
locations.plot(column='variable')
Choropleth with classification scheme:
locations.plot(column='variable', scheme='quantiles', k=7, cmap='viridis')
Key choices:
k
)scheme
)cmap
)locations.plot(column='variable', scheme='Quantiles', k=7, cmap='viridis')
Choropleths necessarily imply information loss (but that's OK)
Tension between:
k
)k
)Rule of thumb: 3 to 12 classes or "bins"
locations.plot(column='variable', scheme='quantiles', k=7, cmap='viridis')
How do we allocate every value in our
variable
into one of thek
groups?
Two (common) approaches for continuous variables:
'equal_interval'
)'quantiles'
)locations.plot(column='variable', scheme='equal_interval', k=7, cmap='Purples')
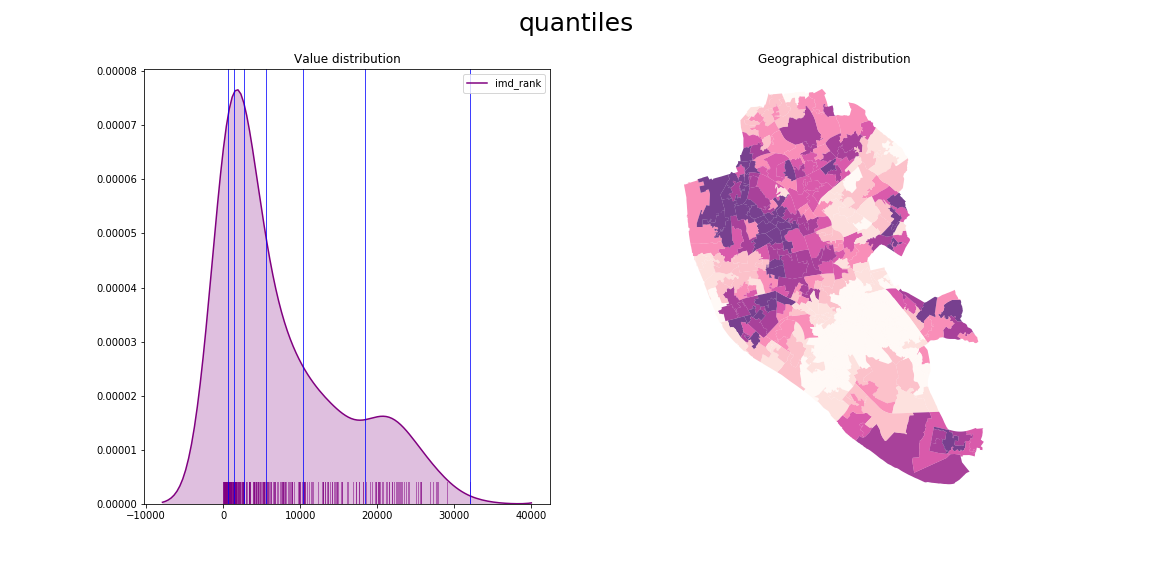
locations.plot(column='variable', scheme='quantiles', k=7, cmap='Purples')
Categories, non-ordered
locations.plot(column='variable',
categorical=True, cmap='Purples')
Graduated, sequential
locations.plot(column='variable',
k=5, cmap='RdPu')
Graduated, divergent
locations.plot(column='variable',
k=5, cmap='RdYlGn')
IMPORTANT: Align with your purpose
Working with Geospatial Data in Python