Working with raster data
Working with Geospatial Data in Python

Joris Van den Bossche
Open source software developer and teacher, GeoPandas maintainer
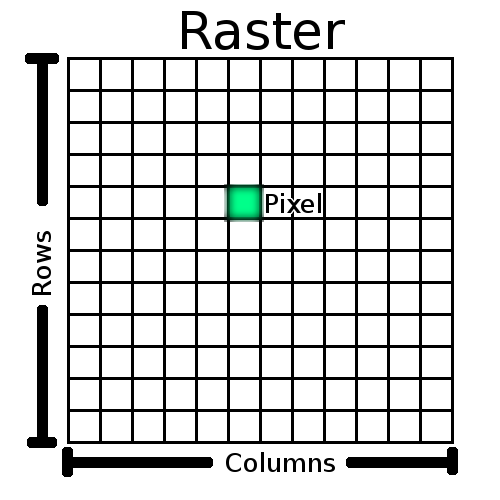
Image source: QGIS documentation
Raster data
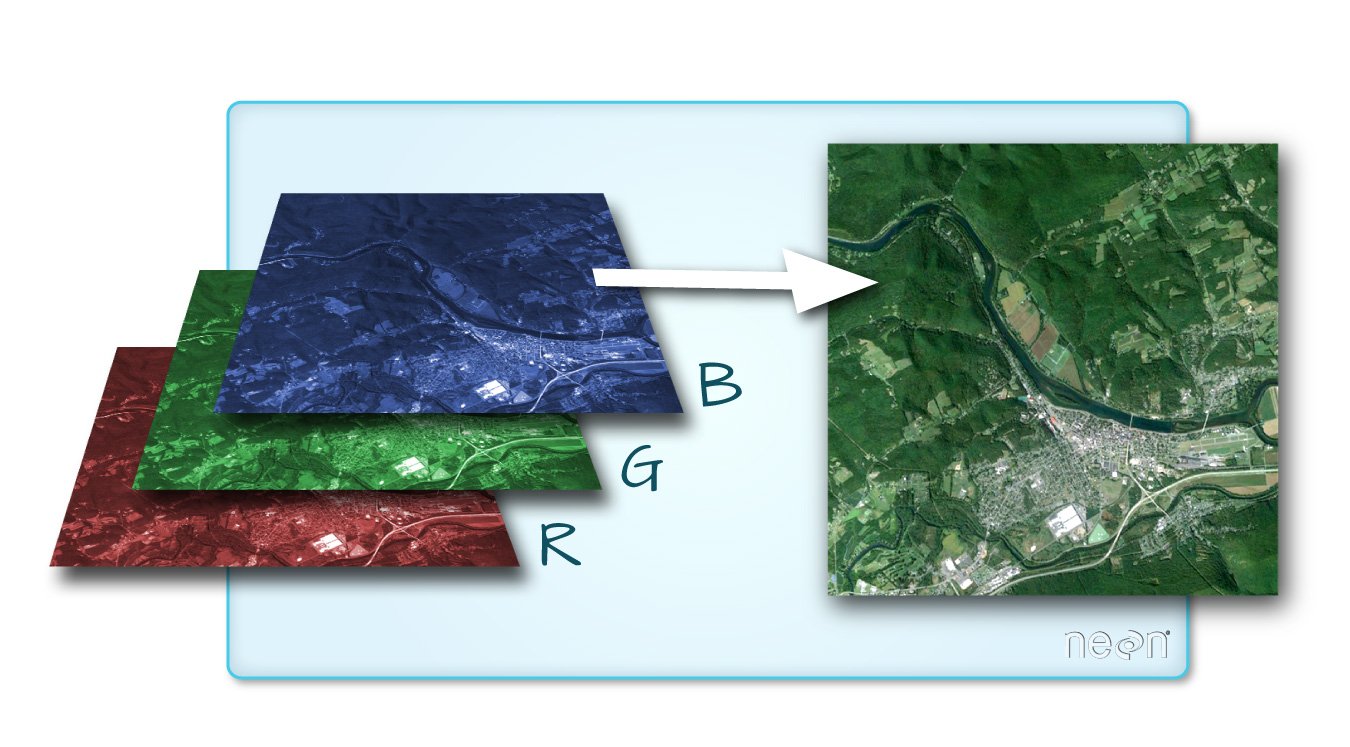
Raster data with multiple bands
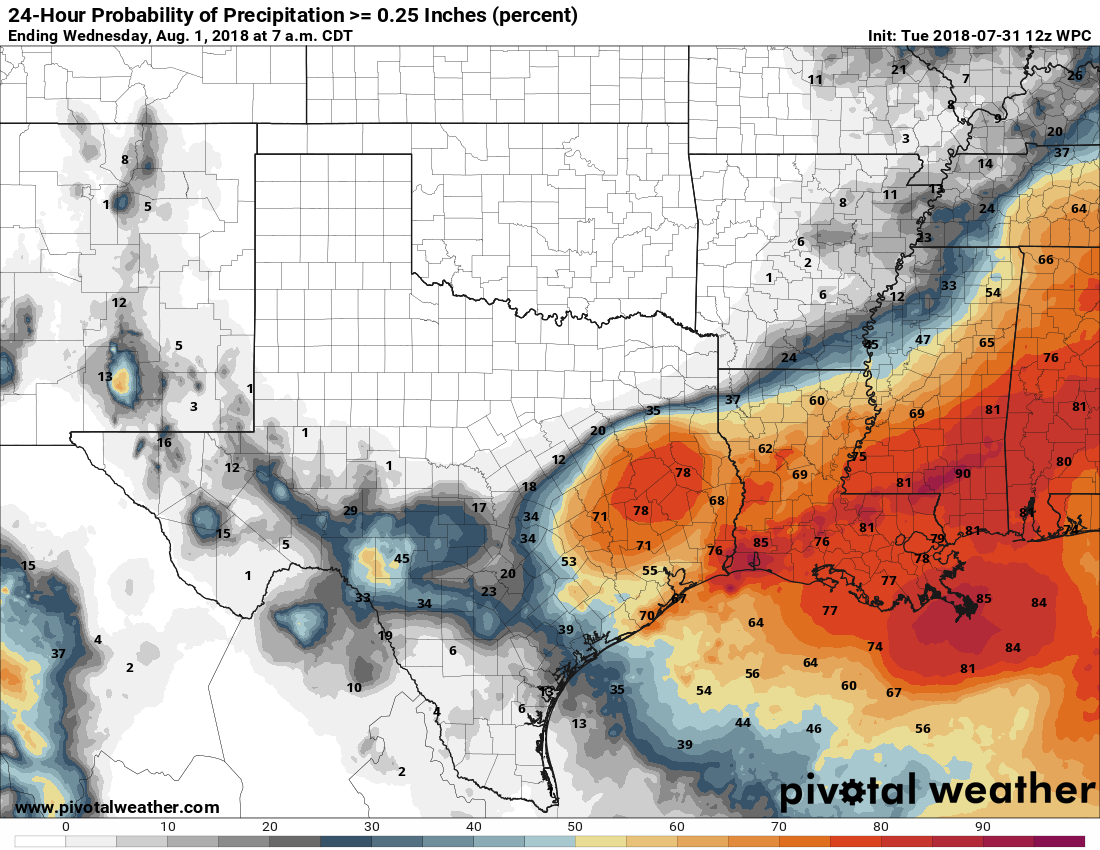
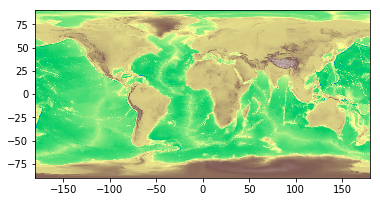
Plotting a raster dataset
Using the rasterio.plot.show() method:
import rasterio.plot

rasterio.plot.show(src, cmap='terrain')
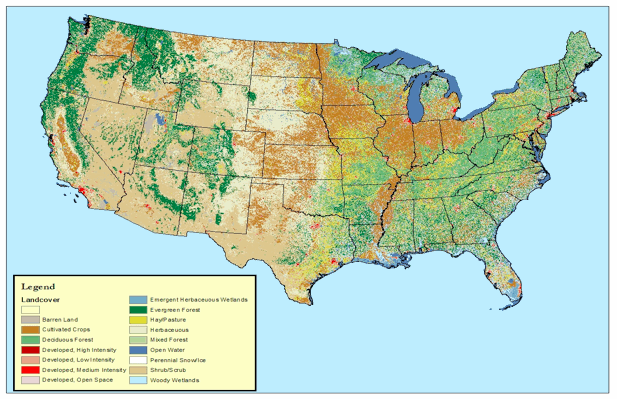
Extracting information based on vector data
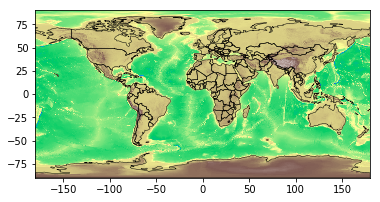
rasterstats: Summary statistics of geospatial raster datasets based on vector geometries (https://github.com/perrygeo/python-rasterstats)

