ggplot2 and binomial GLM
Generalized Linear Models in R

Richard Erickson
Instructor
What can I see in my data?
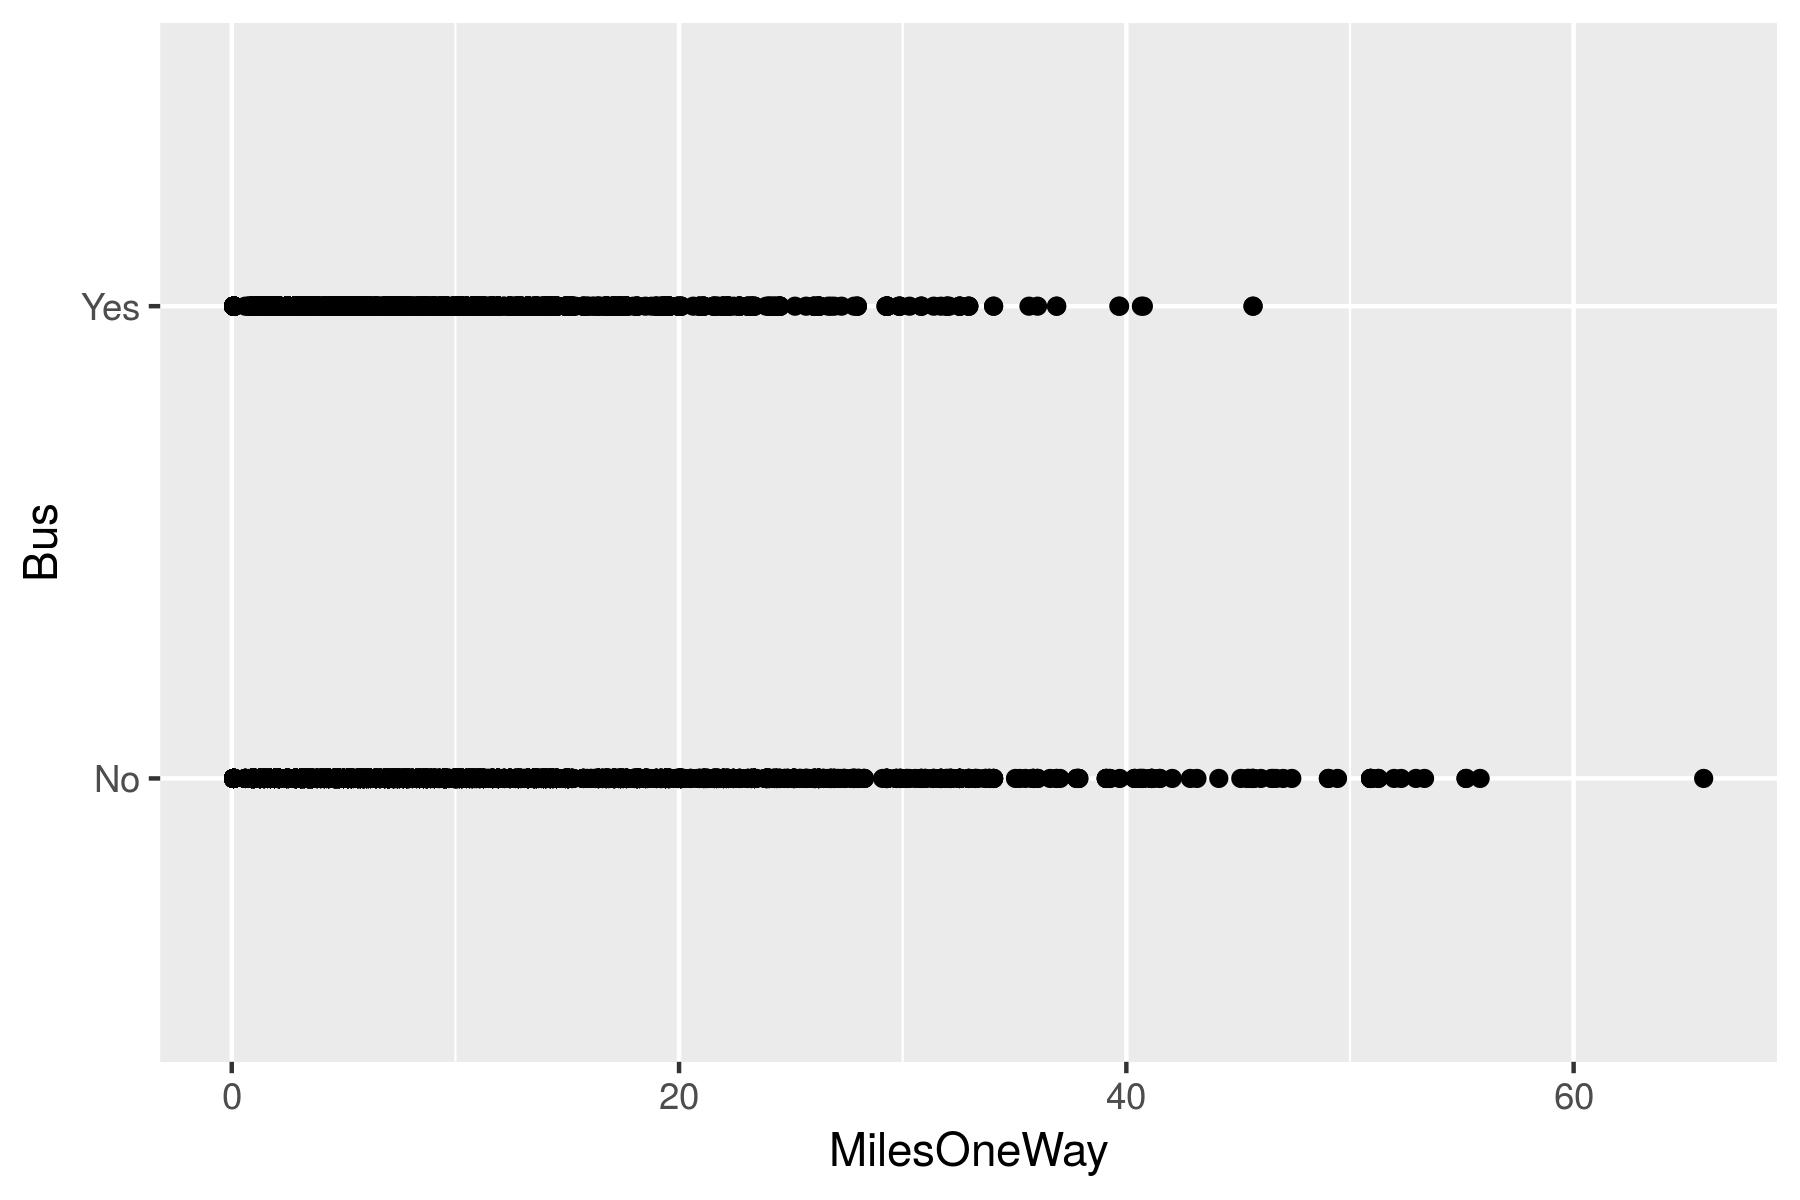
Does commute distance change the probability of taking the bus?
ggplot(bus, aes(x = MilesOneWay, y = Bus)) + geom_point()
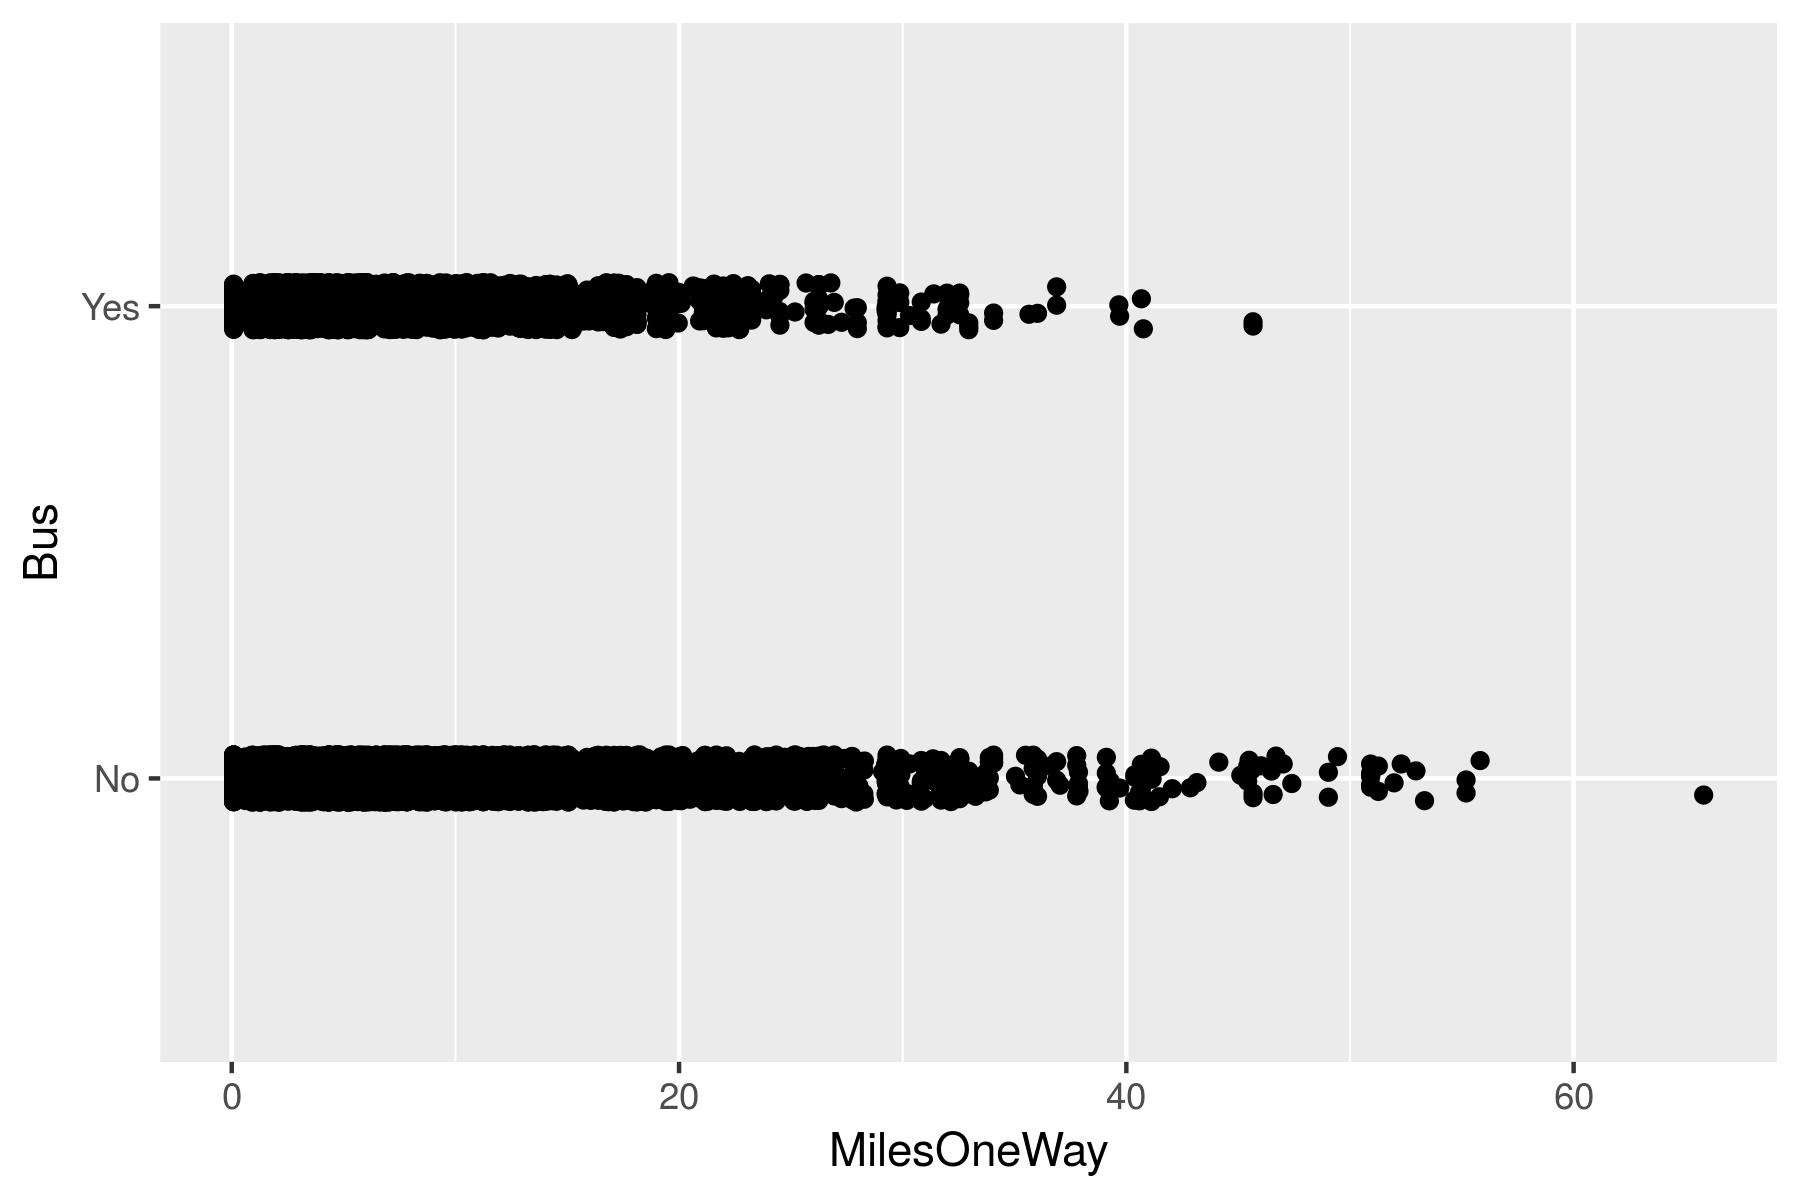
geom_jitter()
gg_jitter <- ggplot(bus, aes(x = MilesOneWay, y = Bus)) +
             geom_jitter(width = 0, height = 0.05)
print(gg_jitter)
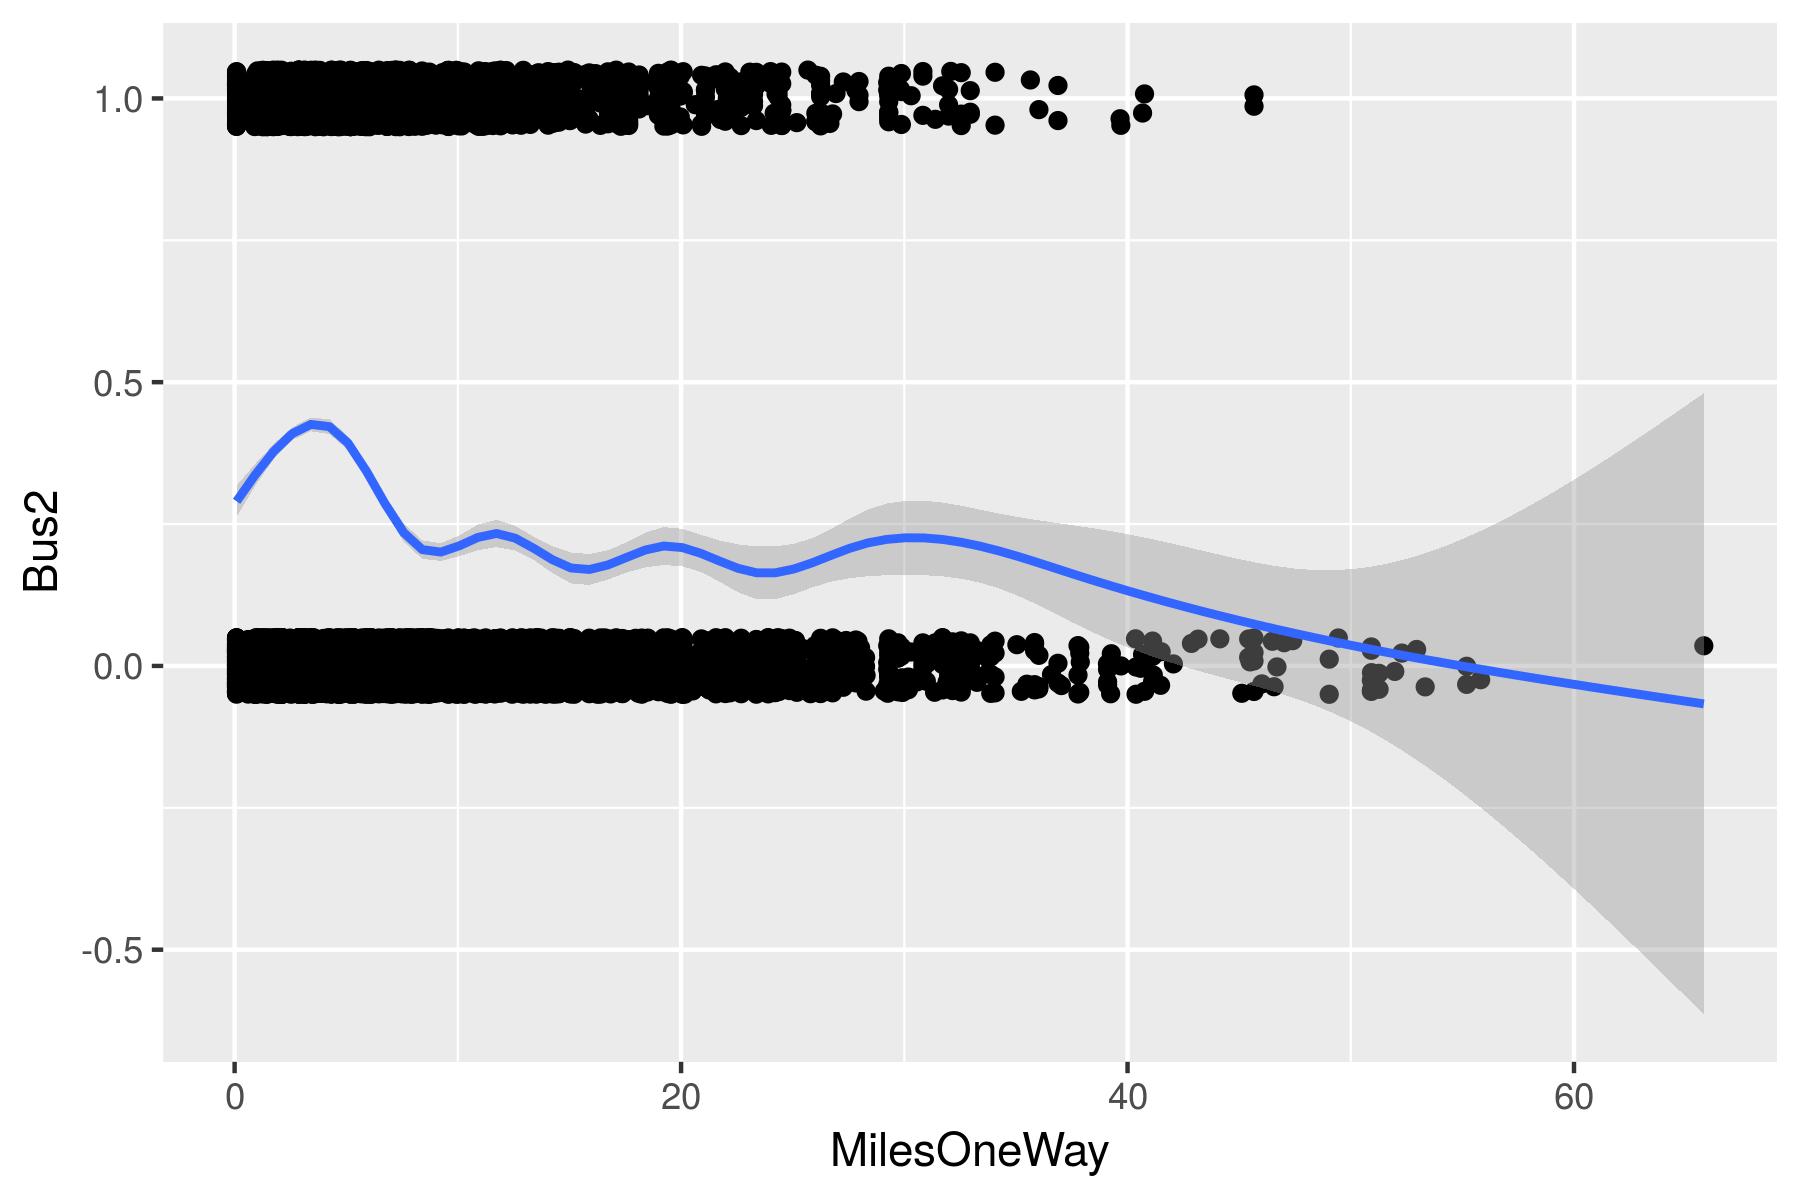
geom_smooth()
gg_jitter + geom_smooth()
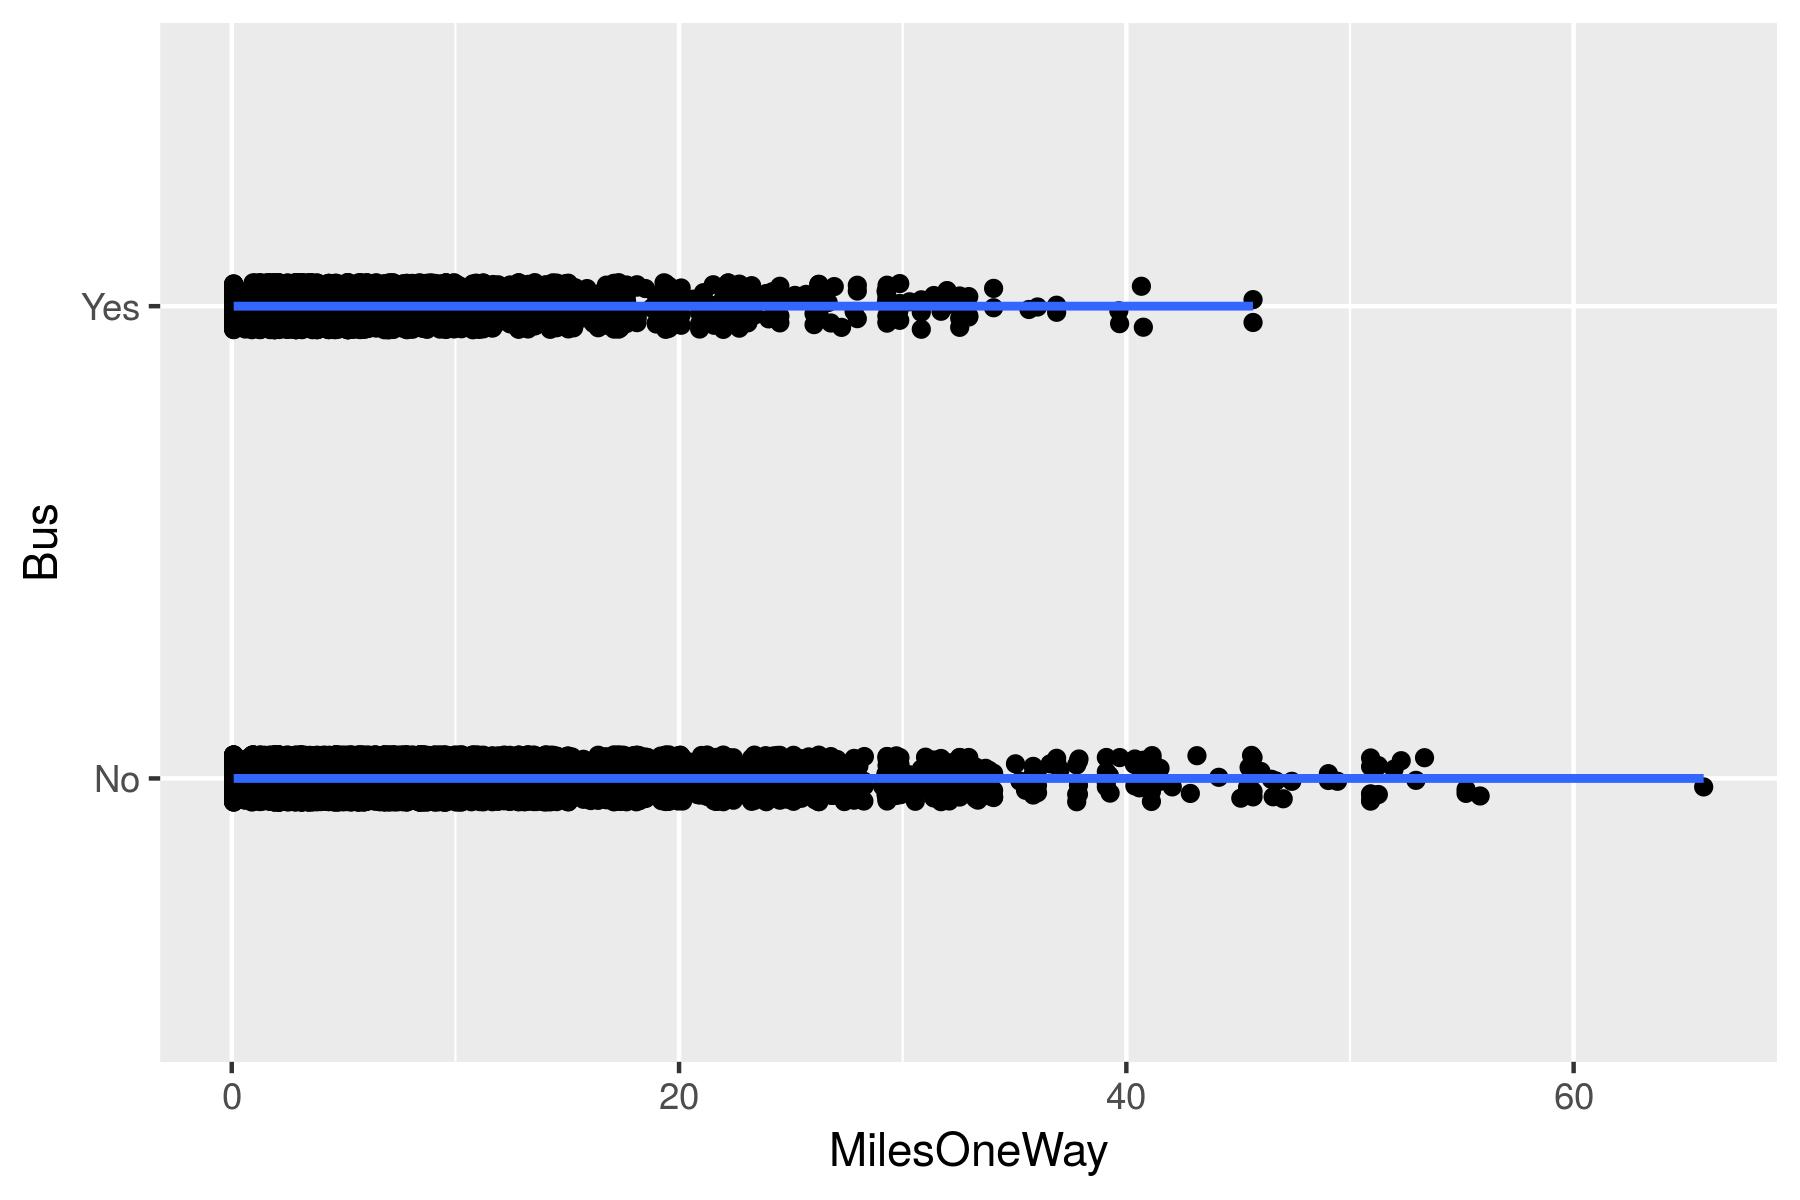
geom_smooth()
gg_jitter + geom_smooth()
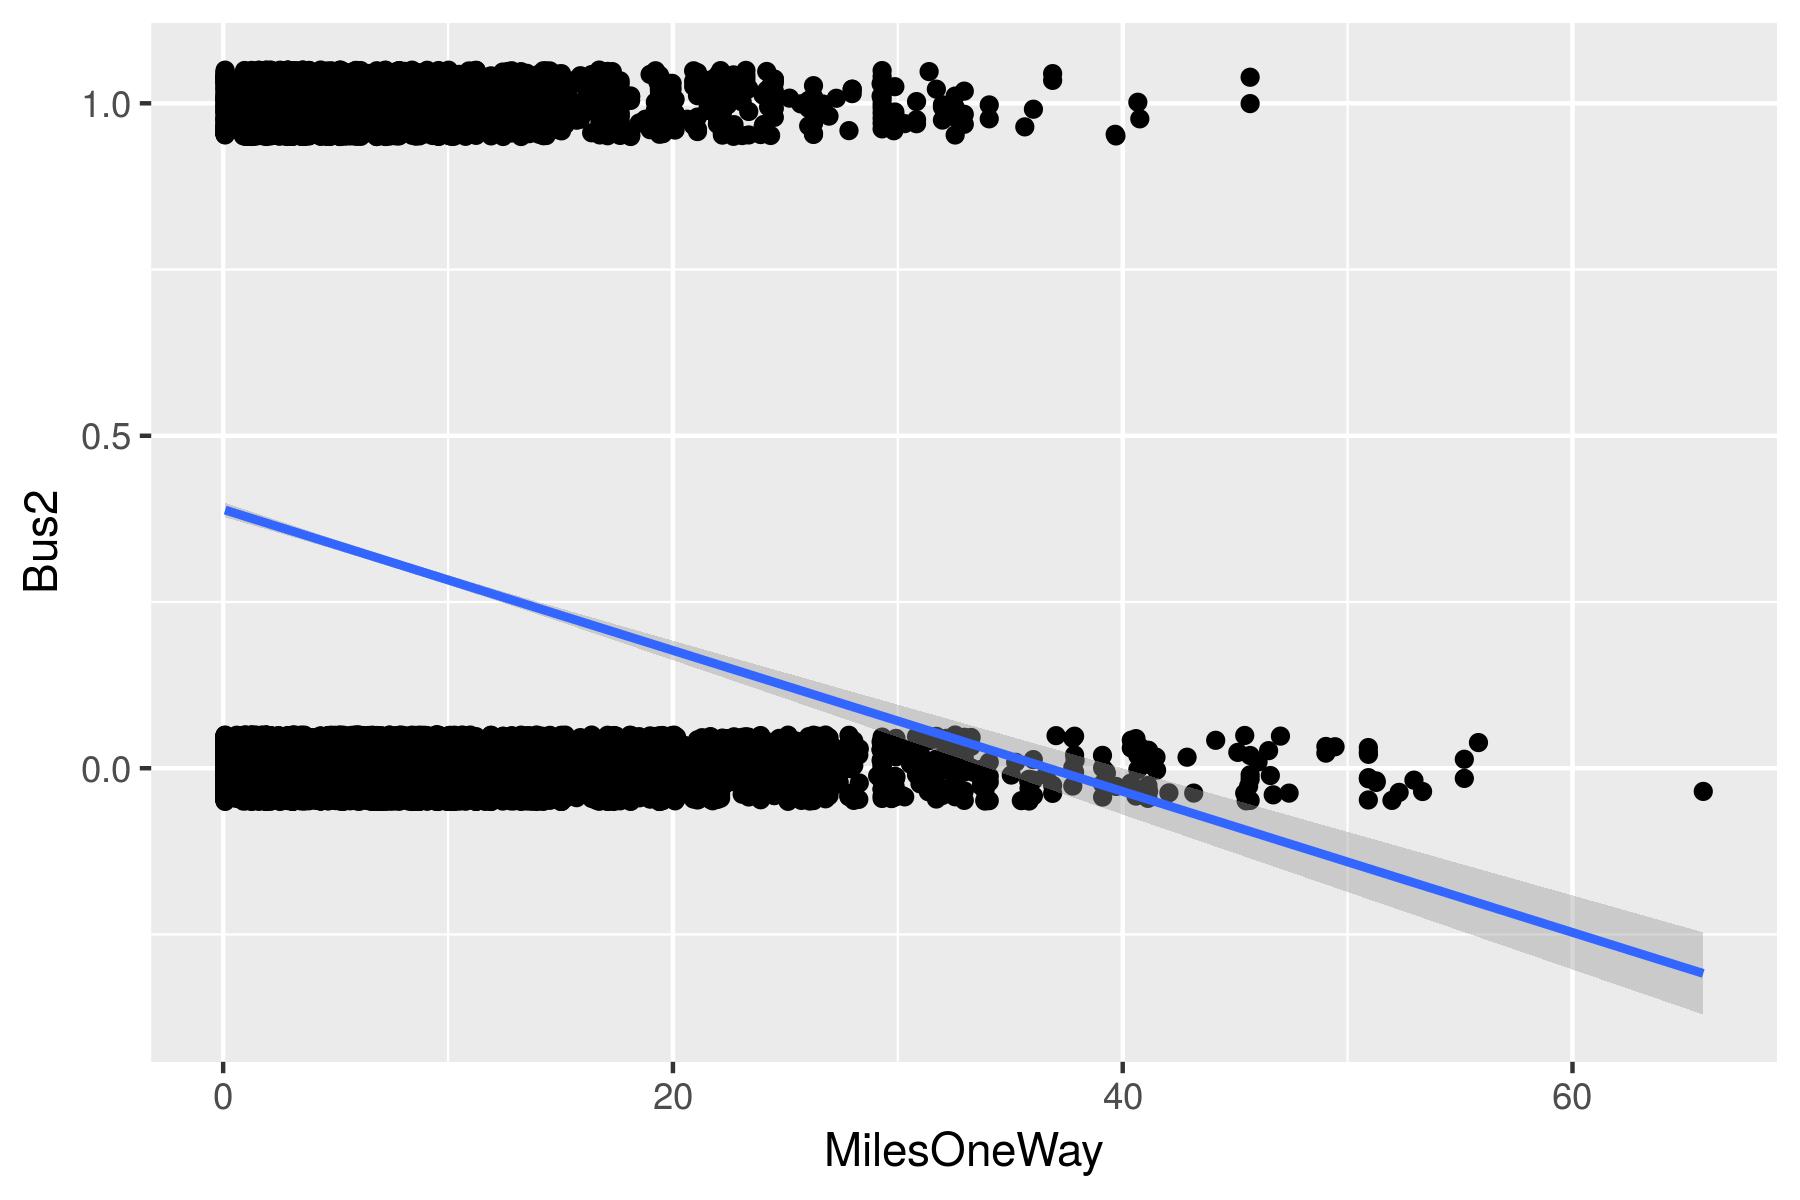
linear models
gg_jitter + geom_smooth(method = 'glm')
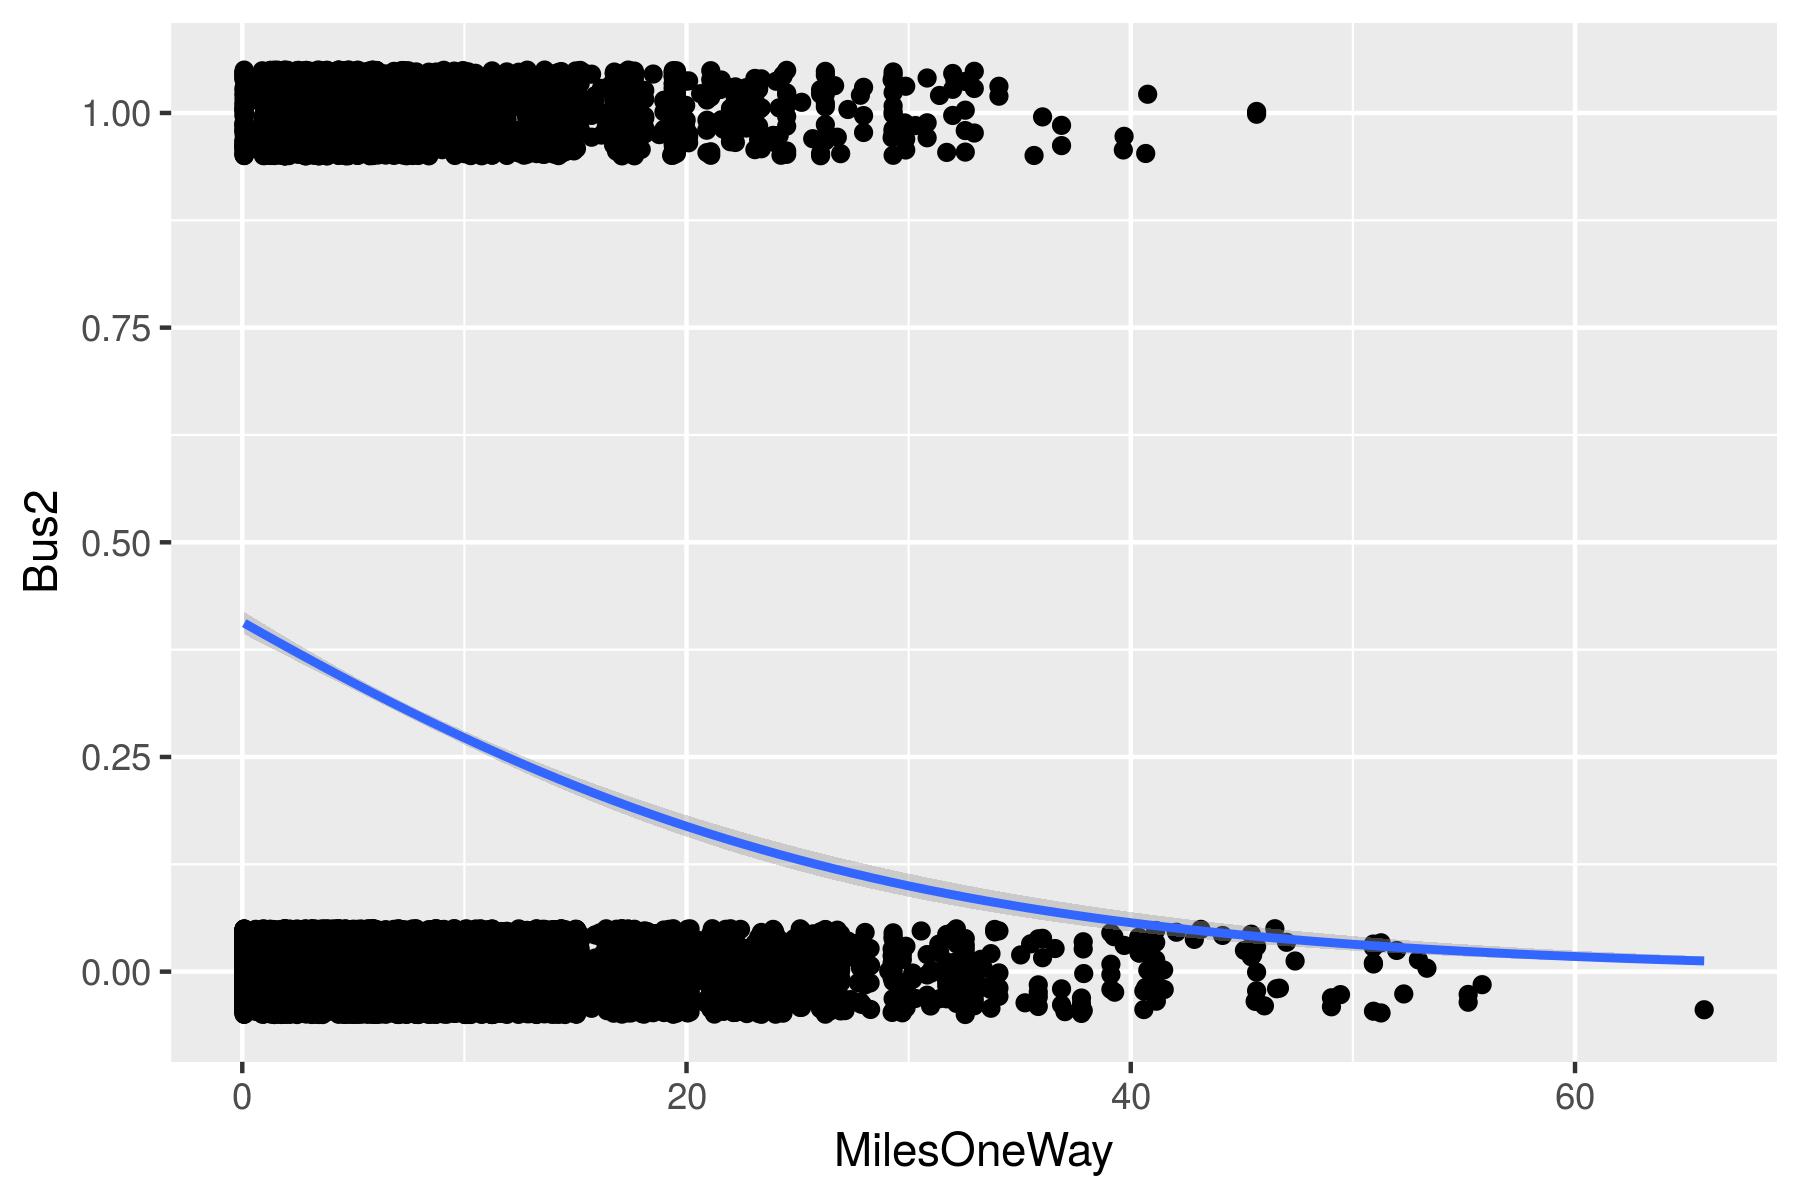
Logistic regressions
ggJitter +
geom_smooth(method = 'glm',
            method.args = list(family = "binomial"))
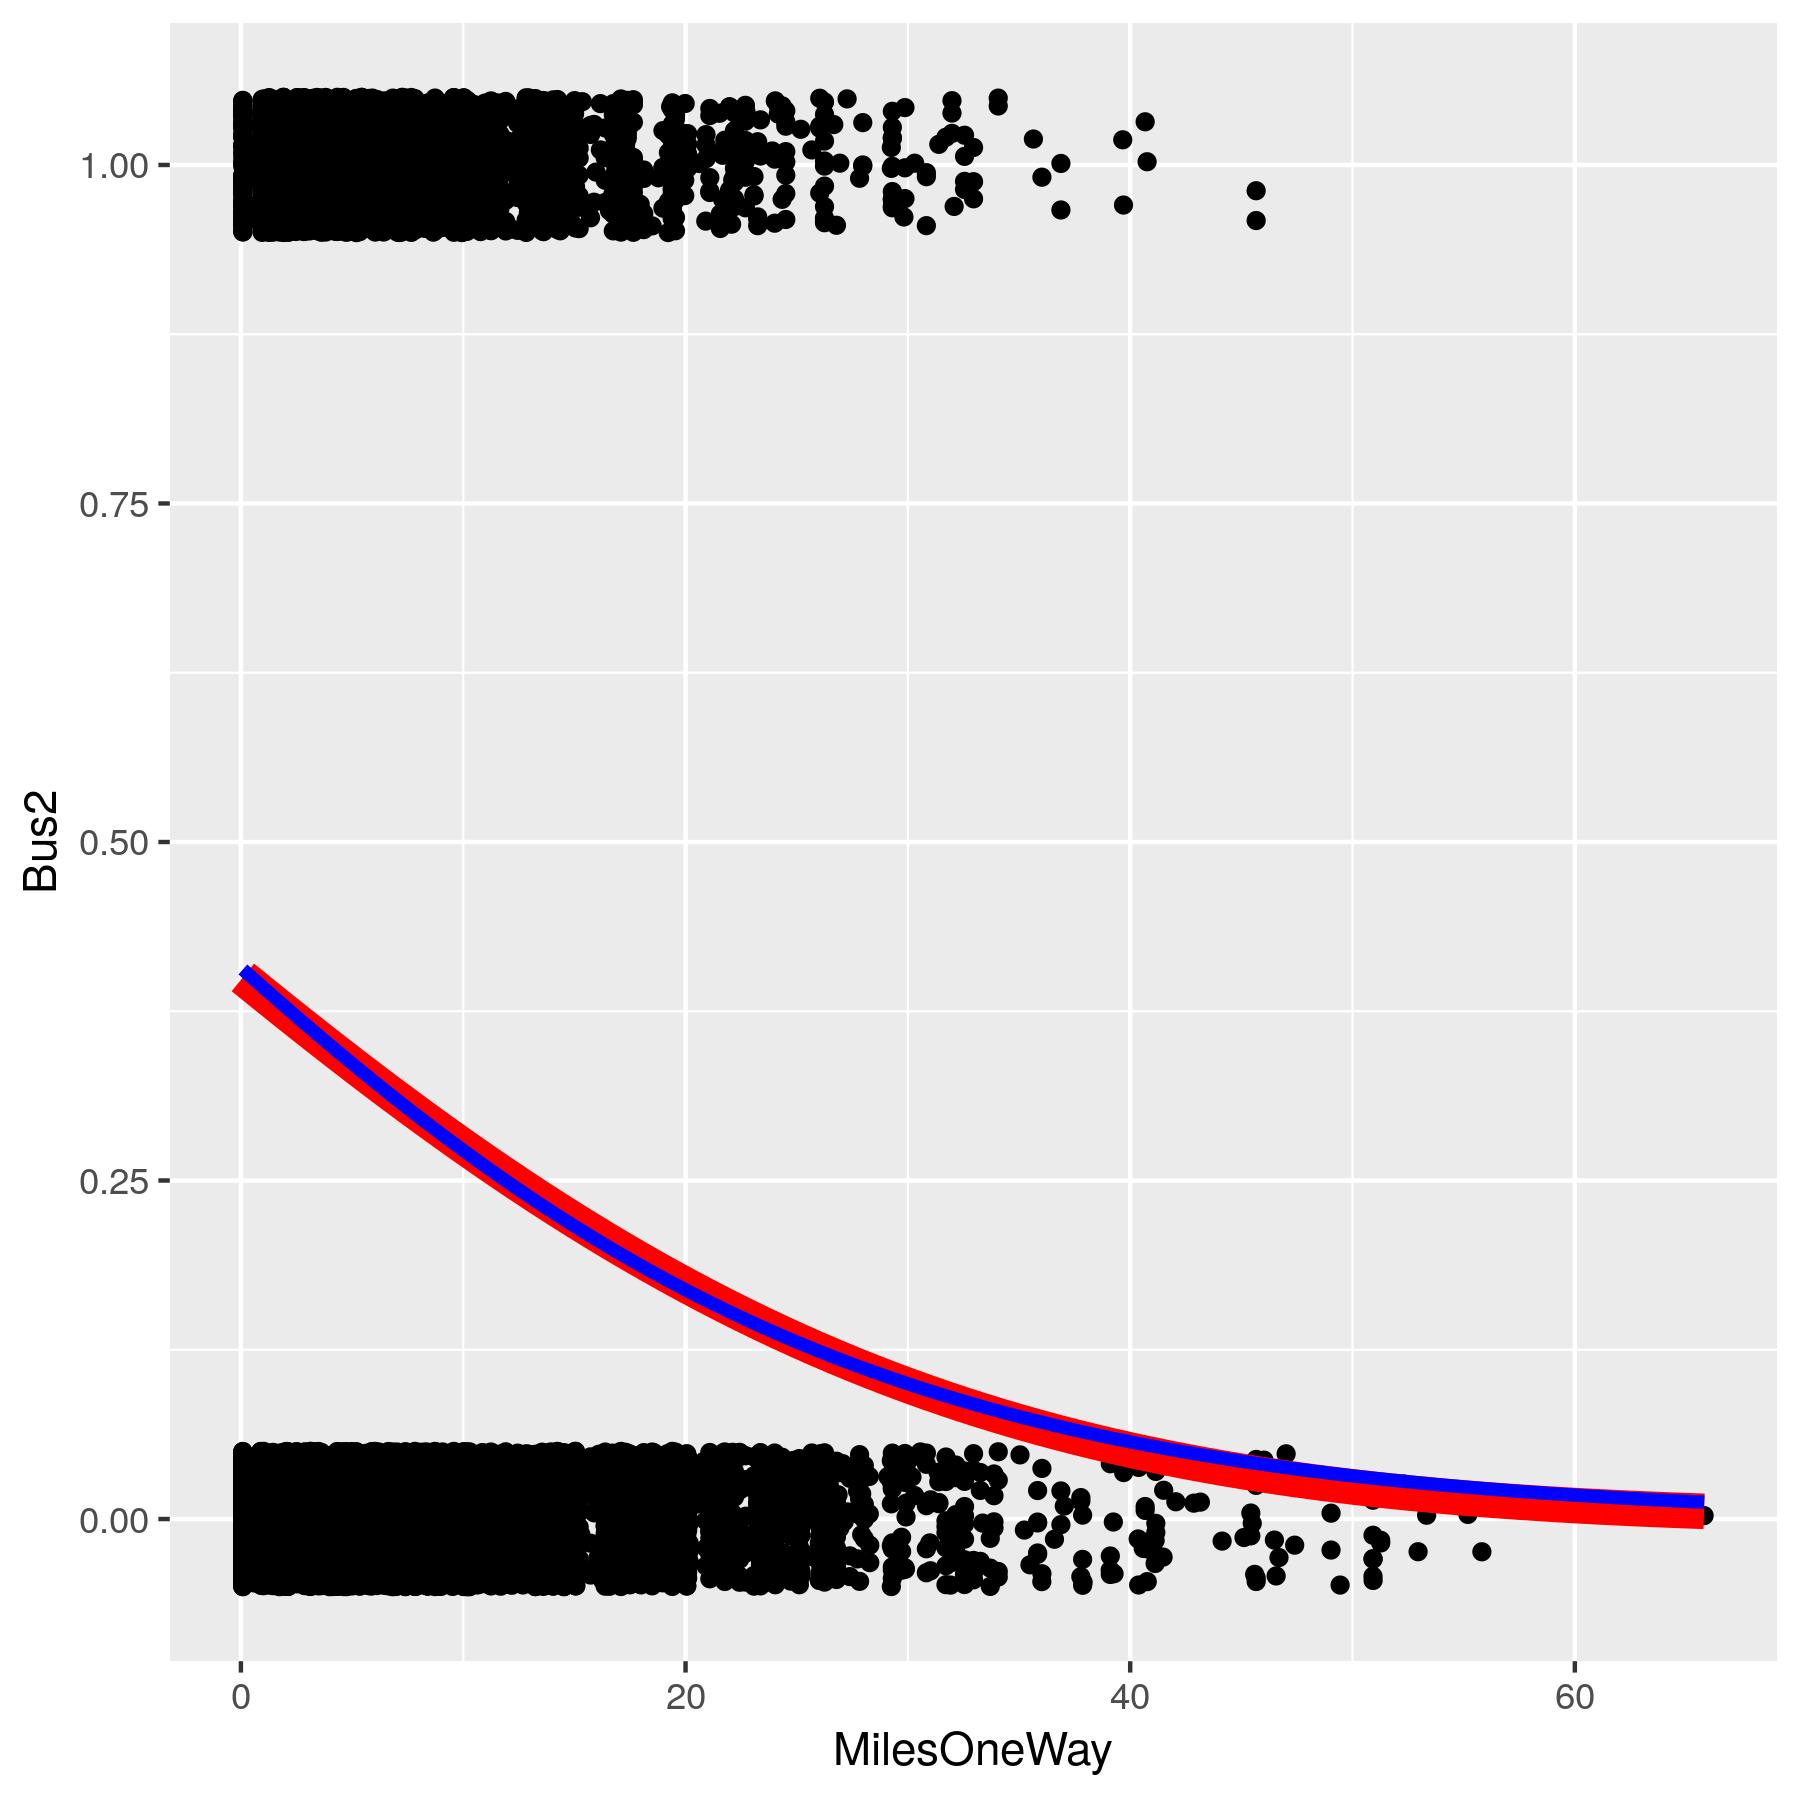
gg_jitter +
    geom_smooth(method = 'glm',
                method.args = list(family = binomial(link = 'logit')),
                se = FALSE, color = 'red') +
    geom_smooth(method = 'glm',
                method.args = list(family = binomial(link = 'probit')),
                se = FALSE, color = 'blue')