Histogram
Intermediate Python

Hugo Bowne-Anderson
Data Scientist at DataCamp
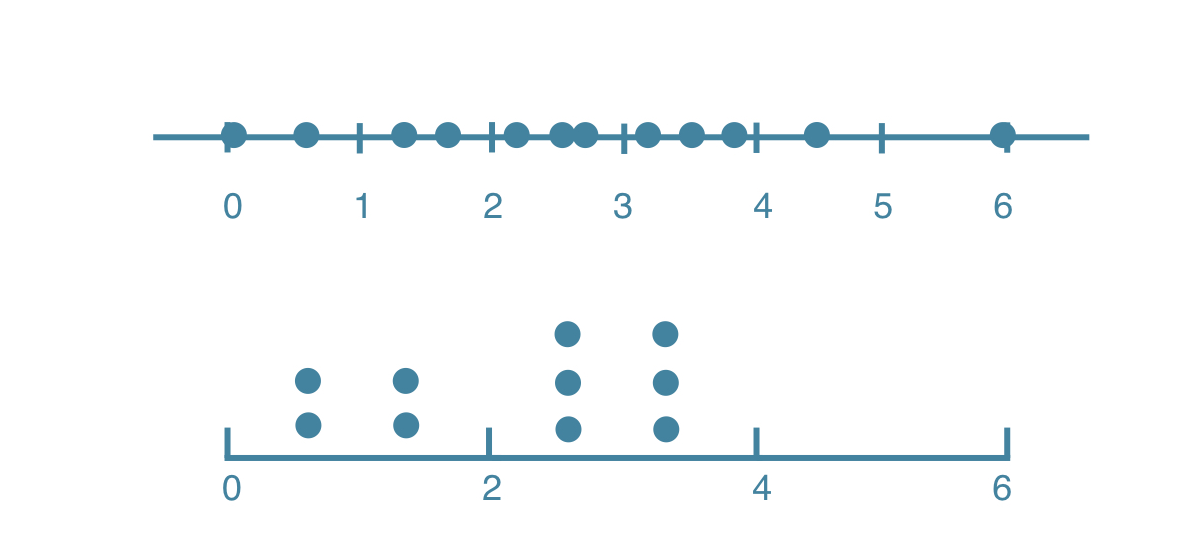
Histogram
- Explore dataset
- Get idea about distribution
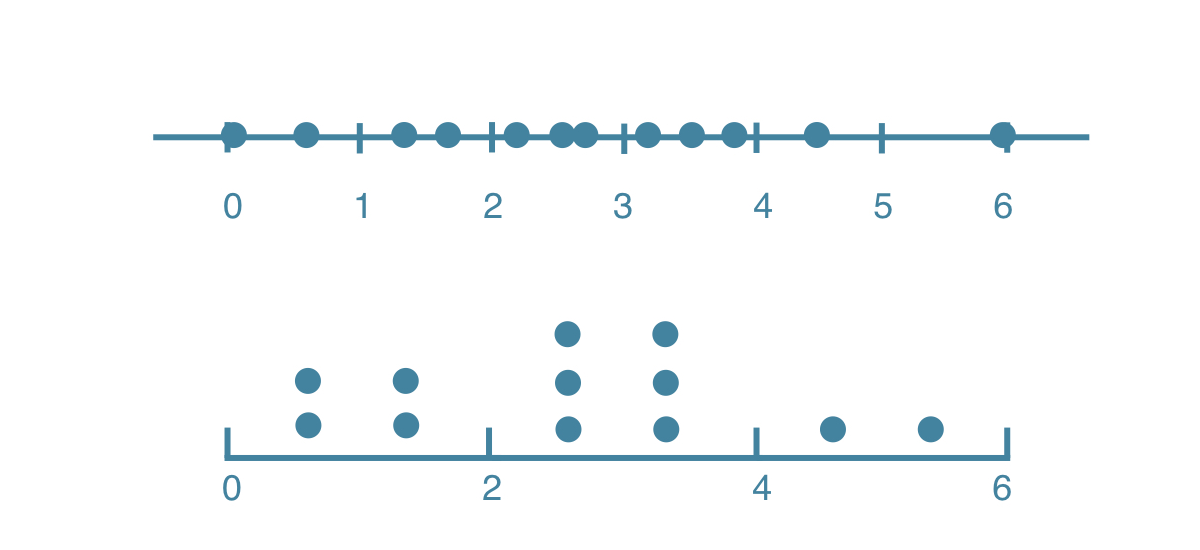
Histogram
- Explore dataset
- Get idea about distribution
Histogram
- Explore dataset
- Get idea about distribution
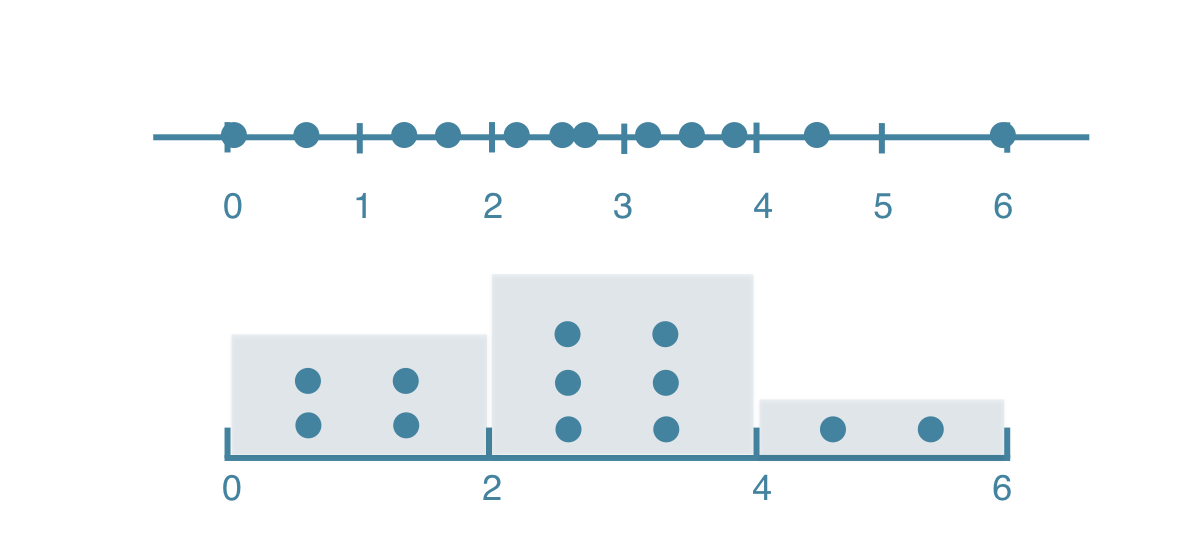
Histogram
- Explore dataset
- Get idea about distribution
Histogram
- Explore dataset
- Get idea about distribution
Histogram
- Explore dataset
- Get idea about distribution
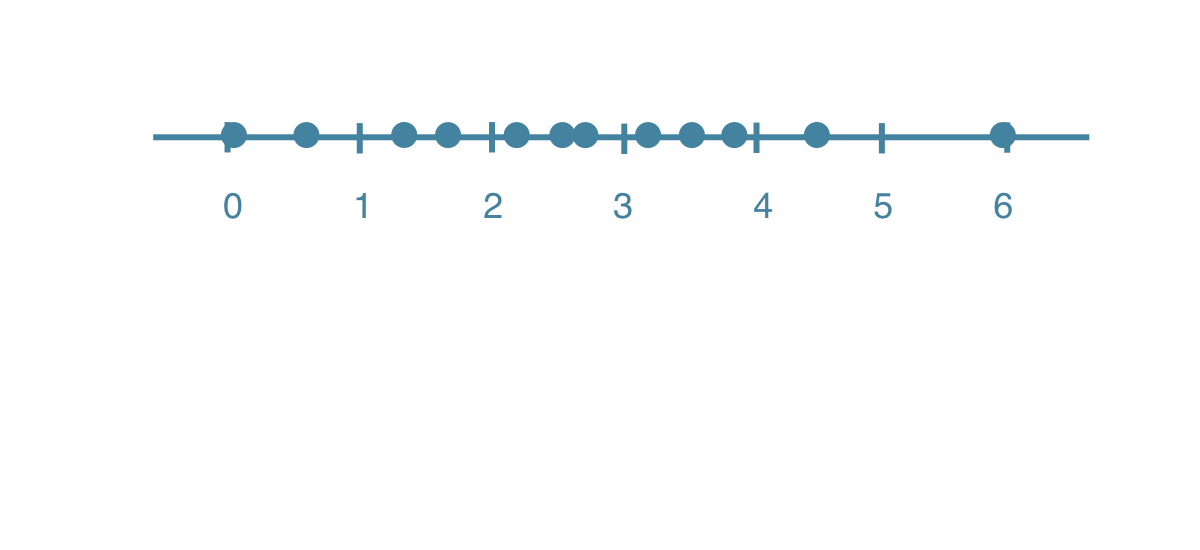
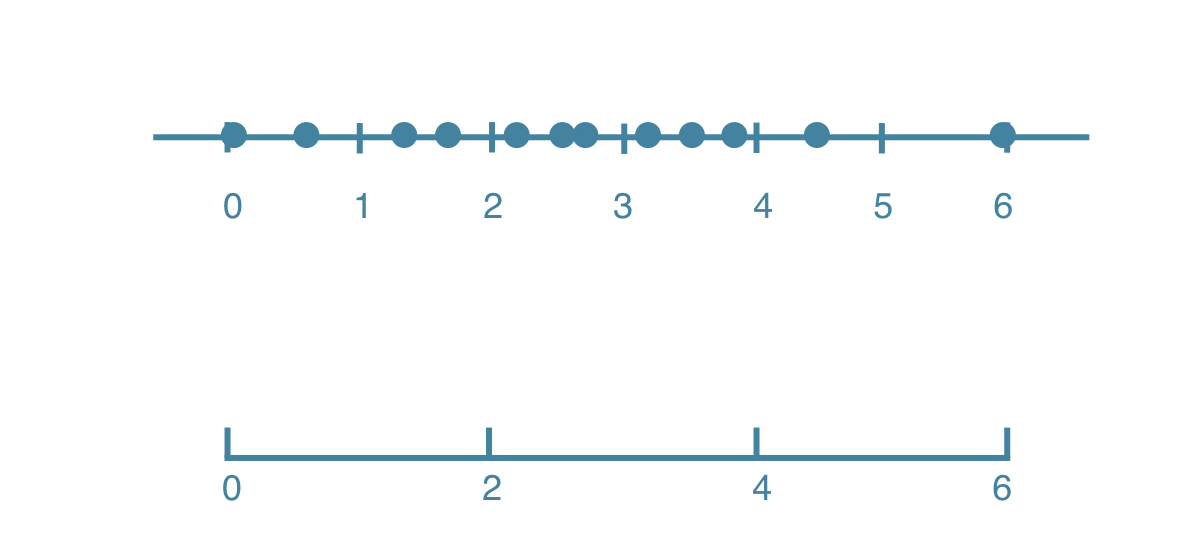
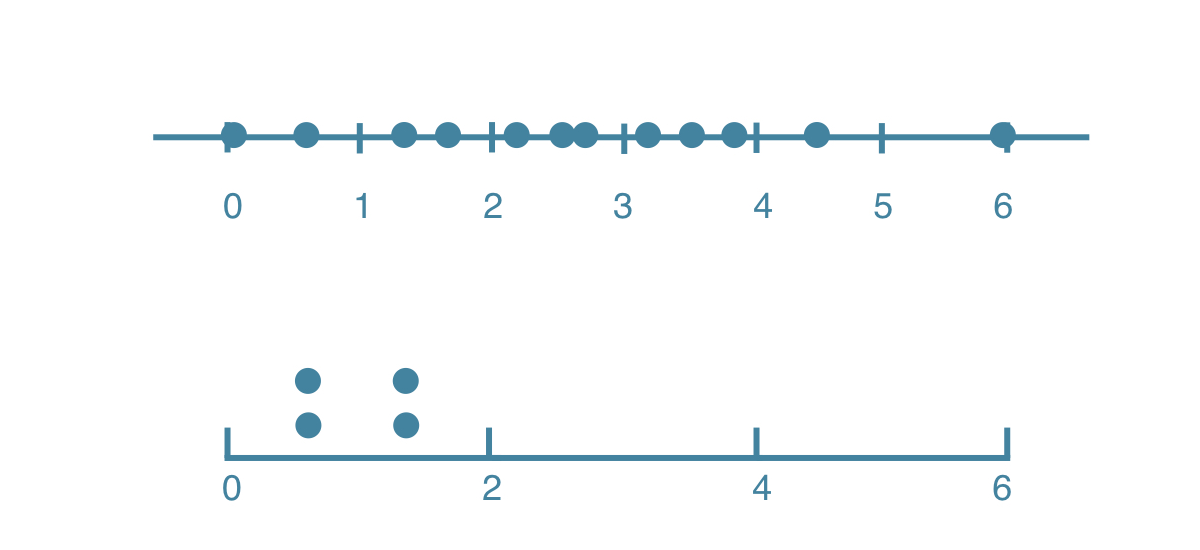
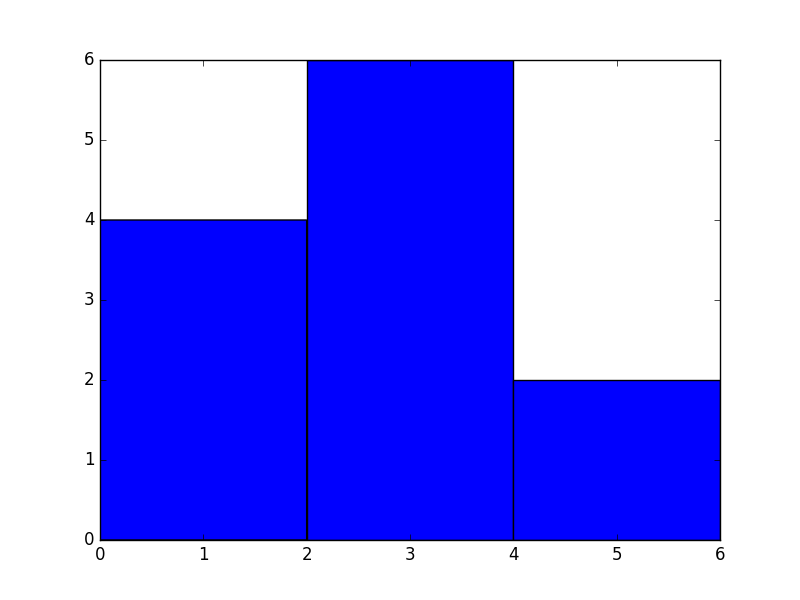
Matplotlib example
values = [0,0.6,1.4,1.6,2.2,2.5,2.6,3.2,3.5,3.9,4.2,6]plt.hist(values, bins=3)plt.show()
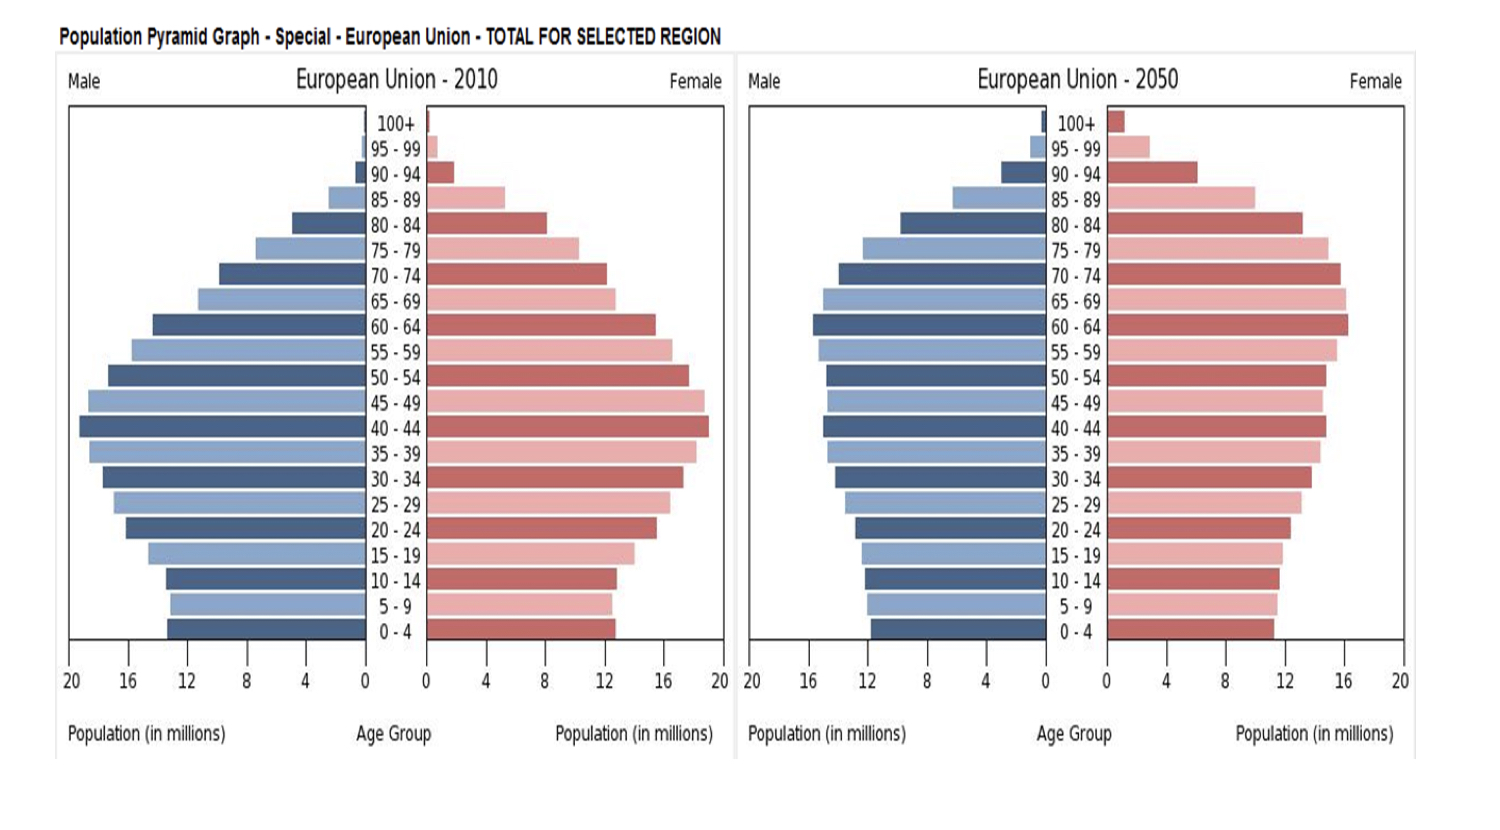
Population pyramid
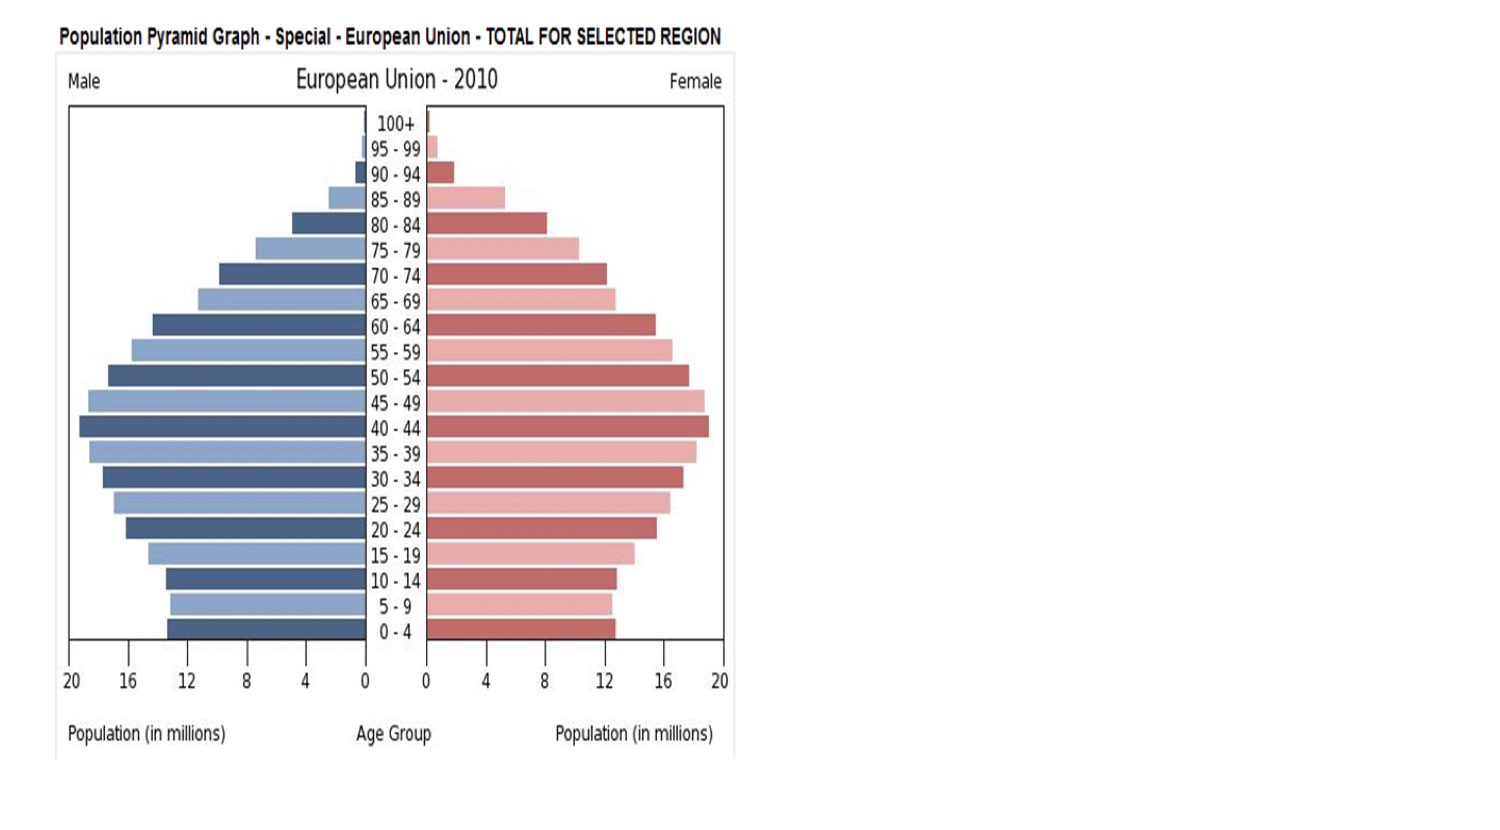
Population pyramid