Introduction & Motivation
Fraud Detection in R

Bart Baesens
Professor Data Science at KU Leuven
Instructors

Instructors

Instructors

What is fraud?
Fraud is an uncommon, well-considered, imperceptibly concealed, time-evolving and often carefully organized crime which appears in many types and forms.

Key characteristics of successful fraud analytics models

Key characteristics of successful fraud analytics models

Key characteristics of successful fraud analytics models

Key characteristics of successful fraud analytics models

Key characteristics of successful fraud analytics models

Challenges of fraud detection model

Challenges of fraud detection model

Challenges of fraud detection model

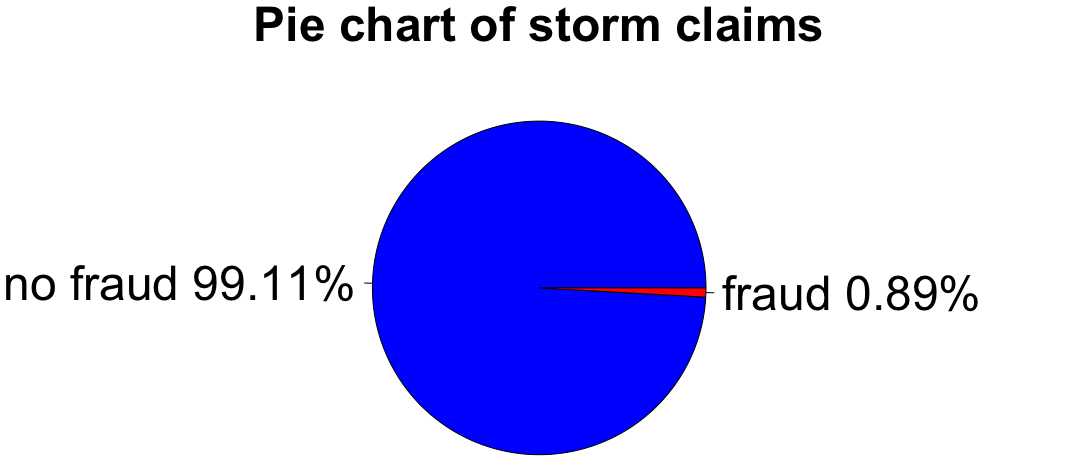
Visualize imbalance with pie chart
labels <- c("no fraud", "fraud")
labels <- paste(labels, round(100 * prop.table(table(fraud_label)), 2), "%")
pie(table(fraud_label), labels, col = c("blue", "red"),
      main = "Pie chart of storm claims")
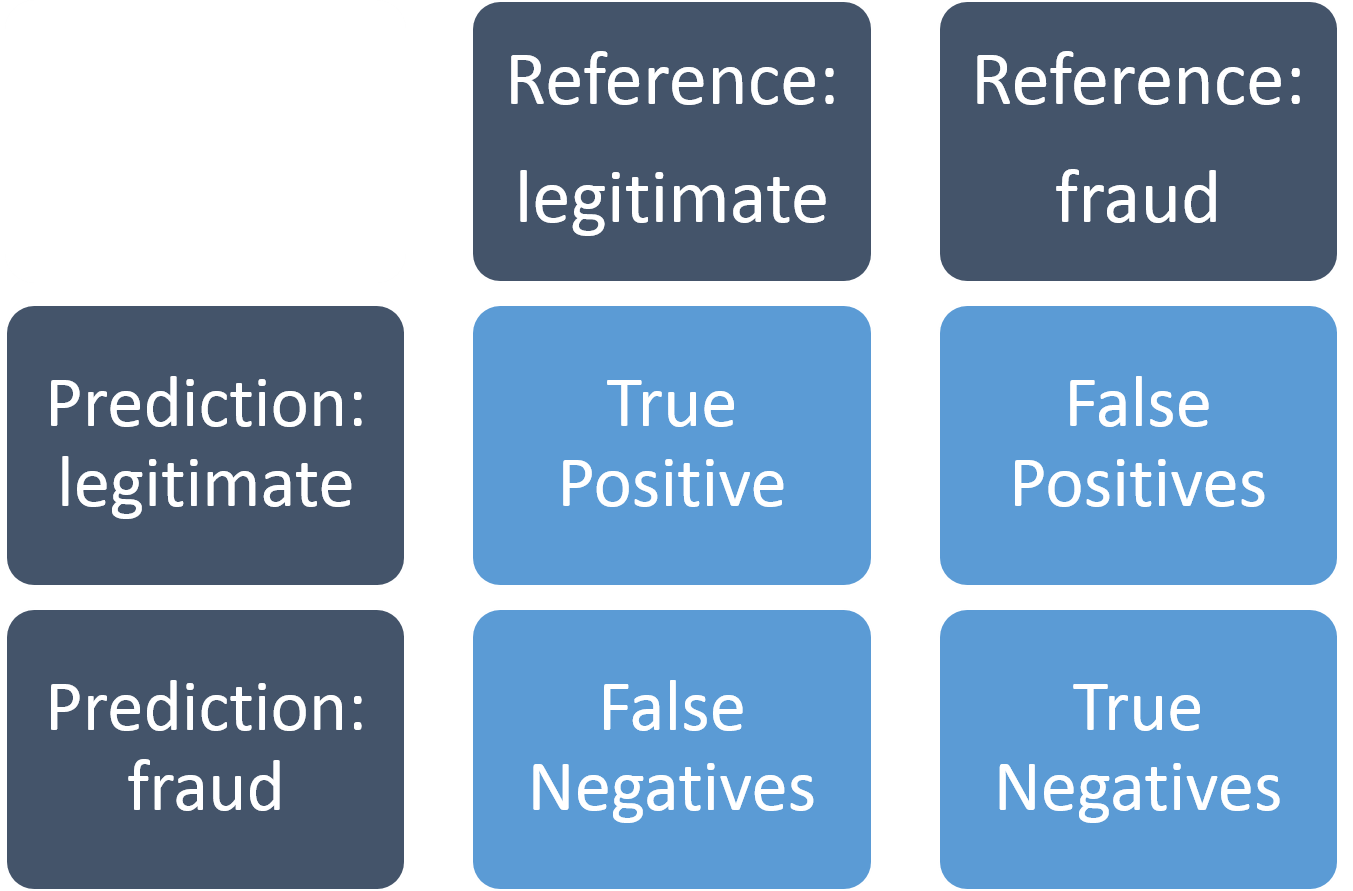
Confusion matrix
Used for evaluating fraud detection model: