Detecting univariate outliers

Fraud Detection in R

Tim Verdonck

Professor Data Science at KU Leuven

Outliers

An outlier is an observation that deviates from the pattern of the majority of the data. outlierfish An outlier can be a warning for fraud.

Fraud Detection in R

Outlier detection

  • A popular tool for outlier detection is

    • to calculate z-score for each observation
    • flag observation as outlier if its z-score has absolute value greater than 3
  • The z-score $z_i$ for observation $x_i$ is calculated as:

$$z_i=\frac{x_i-\hat{\mu}}{\hat{\sigma}} = \frac{x_i-\overline{x}}{s}$$

  • $\overline{x}$ is the sample mean: $\overline{x}=\frac{1}{n}\sum_i x_i$
  • $s$ is sample standard deviation: $s= \sqrt{\frac{1}{n-1}\sum_i(x_i-\hat{\mu})^2}$
Fraud Detection in R

Dataset loginc contains monthly incomes of 10 persons after log transformation:

loginc: 7.876 7.681 7.628  ...  7.764 9.912 # <-- last income is clearly an outlier!
  • (1) Compute the z-score of each observation
Mean <- mean(loginc)
Sd <- sd(loginc)
zscore <- (loginc - Mean) / Sd
  • (2) Check whether z-scores are larger than 3 in absolute value
abs(zscore) > 3
FALSE FALSE FALSE FALSE FALSE FALSE FALSE FALSE FALSE FALSE
  • No outliers are identified using these z-scores!
Fraud Detection in R

Robust statistics

  • Classical statistical methods rely on (normality) assumptions, but even single outlier can influence conclusions significantly and may lead to misleading results.
  • Robust statistics produce also reliable results when data contains outliers and yield automatic outlier detection tools.
  • "It is perfect to use both classical and robust methods routinely, and only worry when they differ enough to matter... But when they differ, you should think hard." J.W. Tukey (1979)
Fraud Detection in R

Estimators of location: mean & median

Sample mean: $$\overline{x}=\frac{1}{n}\sum_i x_i$$

mean(loginc)

mean(loginc9)
7.986447

7.772392

loginc9 contains same observations as loginc except for the outlier.

Order $n$ observations from small to large, then sample median, $Med(X_n)$, is $(n+1)/2$th observation (if $n$ is odd) or average of $n/2$th and $n/2+1$th observation (if $n$ is even).

median(loginc)
7.816658
median(loginc9)
7.764296
Fraud Detection in R

Estimators of scale: sd

(1) Sample standard deviation: $$s= \sqrt{\frac{1}{n-1}\sum_i (x_i-\hat{\mu})^2}$$

sd(loginc)
0.6976615
sd(loginc9)
0.1791729
Fraud Detection in R

Estimators of scale: mad, IQR

(2) Median absolute deviation: $$Mad(X_n)=1.4826Med(|x_i-Med(X_n)|)$$

(3) Interquantile range (normalized): $$IQR(X_n)= IQR = 0.7413(Q_3-Q_1)$$ where $Q_1$ and $Q_3$ are first and third quartile of the data

IQR(loginc)/1.349
0.2056784
mad(loginc)
0.2396159
mad(loginc9)
0.201305
IQR(loginc9)/1.349
0.1839295
Fraud Detection in R

Robust z-scores for outlier detection

Plug in the robust estimators to compute robust z-scores:

$$z_i=\frac{x_i-\hat{\mu}}{\hat{\sigma}} =\frac{x_i-Med(X_n)}{Mad(X_n)}$$

robzscore <- (loginc - median(loginc)) / mad(loginc)

abs(robzscore) > 3 ## Check for outliers
FALSE FALSE FALSE FALSE FALSE FALSE FALSE FALSE FALSE TRUE
robzscore[10] ## Robust z-score of the outlier
8.748523
Fraud Detection in R

Boxplot

  • Tukey’s boxplot is also popular tool to identify outliers
  • Observation is flagged as outlier if it outside the boxplot fence $$[Q_1-1.5IQR; Q_3+1.5IQR]$$

boxplotexplanation

Fraud Detection in R

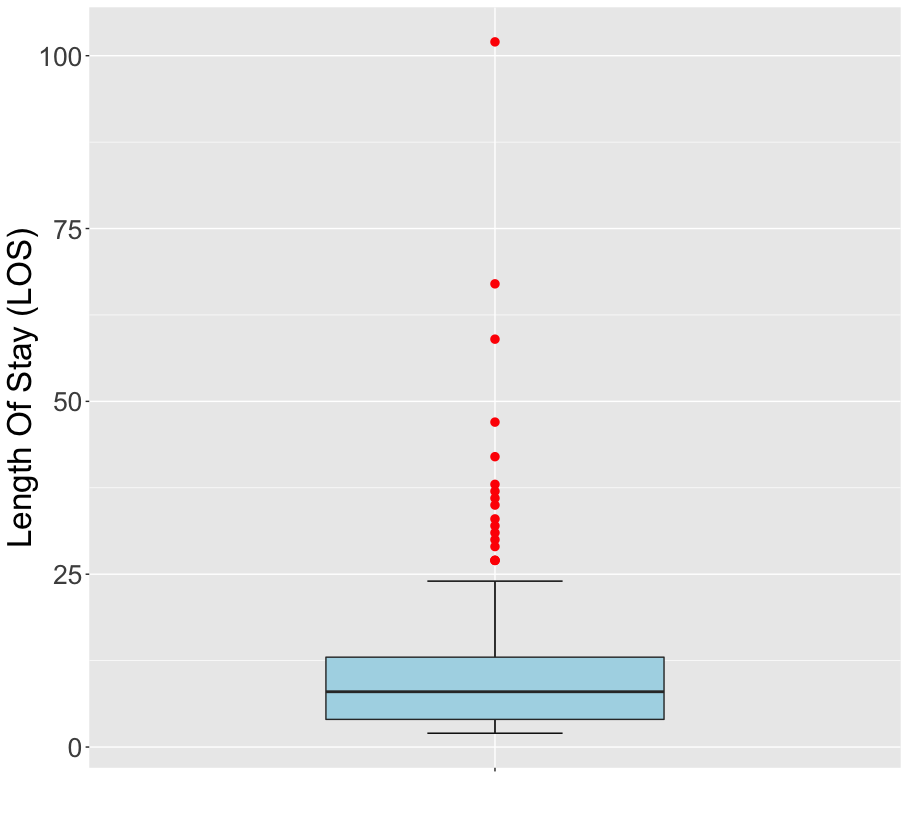
Example: length of stay (LOS) in hospital

boxplot(los, col = "blue", ylab = "Lenght of Stay (LOS)")$out
59  33  42  67  35  47 102  36  27  31  27  30  29  32  37  27  38
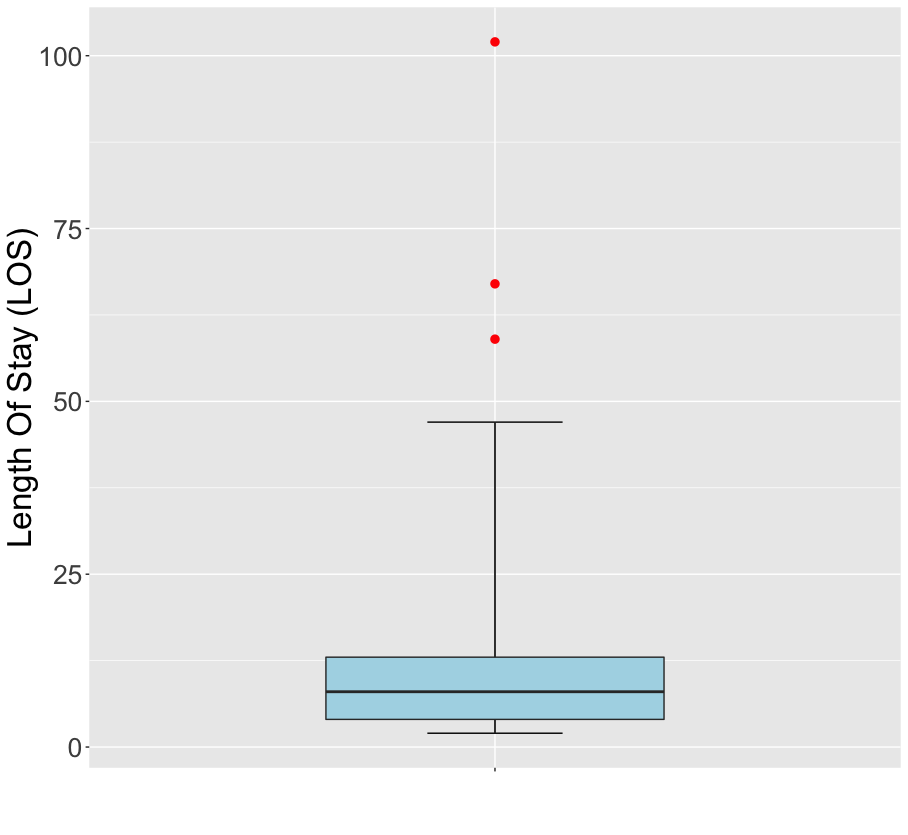
boxplotlos_ggplot

Fraud Detection in R

Adjusted boxplot

  • At asymmetric distributions, boxplot may flag many regular points as outliers.
  • The skewness-adjusted boxplot corrects for this by using a robust measure of skewness in determining the fence (Hubert and Vandervieren, 2008)

chisqbp

Fraud Detection in R

Example LOS: adjusted boxplot

Outliers according to adjusted boxplot:

library(robustbase)
adjbox(los)$out
59  67 102

Statistics computed by adjusted boxplot:

adjboxStats(los)$stats
2  4  8 13 47
Fraud Detection in R

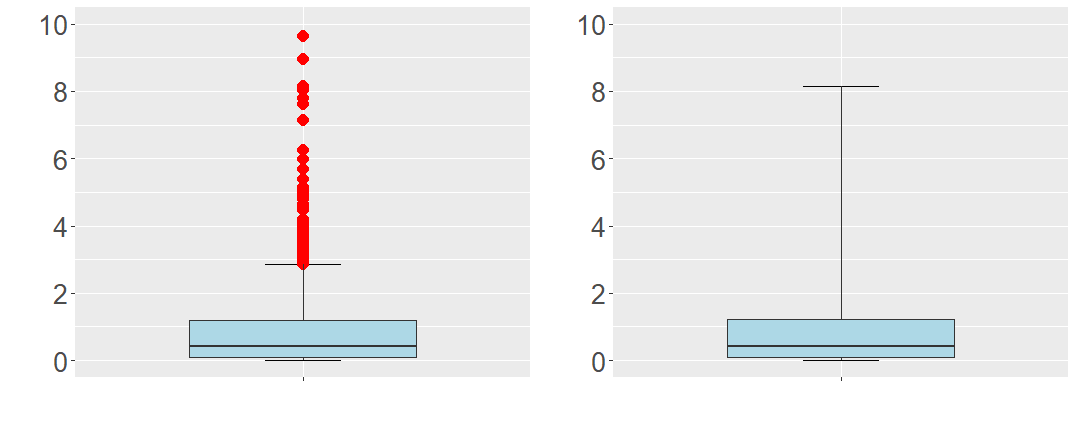
Example LOS: boxplot vs adjusted boxplot

LOS_boxplot

LOS_adjbox

Fraud Detection in R

Let's practice!

Fraud Detection in R

Preparing Video For Download...