Analyzing Social Media Data in Python
Alex Hanna
Computational Social Scientist
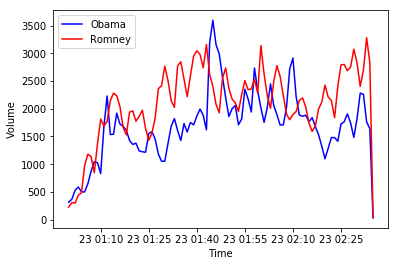
                     sum person
date
2012-10-23 01:00:00  314  Obama
2012-10-23 01:01:00  369  Obama
2012-10-23 01:02:00  527  Obama
2012-10-23 01:03:00  589  Obama
2012-10-23 01:04:00  501  Obama
...
print(tweets['created_at'])
0       Sat Jan 27 18:36:21 +0000 2018
1       Sat Jan 27 18:24:02 +0000 2018
2       Sat Jan 27 18:09:14 +0000 2018
...
tweets['created_at'] = pd.to_datetime(tweets['created_at'])

print(tweets['created_at'])
tweets['created_at'] = pd.to_datetime(tweets['created_at'])
0      2018-01-27 18:36:21
1      2018-01-27 18:24:02
2      2018-01-27 18:09:14
...
tweets = tweets.set_index('created_at')
tweets['google'] = check_word_in_tweet('google', tweets)

print(tweets['google'])
tweets['google'] = check_word_in_tweet('google', tweets)
print(tweets['google'])
created_at
2018-01-27 18:36:21    False
2018-01-27 18:24:02    False
2018-01-27 18:30:12    False
2018-01-27 18:12:37     True
2018-01-27 18:11:06     True
....
print(np.sum(tweets['google']))
247
mean_google = tweets['google'].resample('1 min').mean()

print(mean_google)
mean_google = tweets['google'].resample('1 min').mean()
print(mean_google)
created_at
2018-01-27 18:07:00    0.085106
2018-01-27 18:08:00    0.285714
2018-01-27 18:09:00    0.161290
2018-01-27 18:10:00    0.222222
2018-01-27 18:11:00    0.169231
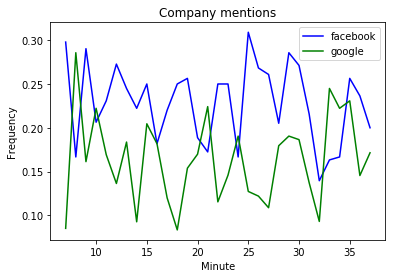
import matplotlib.pyplot as plt

plt.plot(
    means_facebook.index.minute,
    means_facebook, color = 'blue'
    )
plt.plot(
    means_google.index.minute,
    means_google, color = 'green'
    )
plt.xlabel('Minute')
plt.ylabel('Frequency')
plt.title('Company mentions')
plt.legend(('facebook', 'google'))
plt.show()