No pain, no gain
GARCH Models in R

Kris Boudt
Professor of finance and econometrics
GARCH-in-mean model
- Quantify the risk-reward trade-off.
- Risk: $\sigma^2_t$. Reward: $\mu_t$.
- GARCH-in-mean model:
$$ \mu_{t} = \mu + \lambda \sigma^2_{t} $$
$\lambda > 0$ is the risk/reward parameter indicating the increase in expected return per unit of variance risk.
How?
Change the argument mean.model in ugarchspec() from list(armaOrder = c(0, 0)) to list(armaOrder = c(0, 0), archm = TRUE, archpow = 2):
garchspec <- ugarchspec(
              mean.model = list(armaOrder = c(0, 0)),
              variance.model = list(model = "gjrGARCH"),
              distribution.model = "sstd")
garchspec <- ugarchspec(
               mean.model = list(armaOrder = c(0, 0), archm = TRUE, archpow = 2),
               variance.model = list(model = "gjrGARCH"),
               distribution.model = "sstd")
Application to daily S&P 500 returns
Estimation
garchfit <- ugarchfit(data = sp500ret, spec = garchspec)
Inspection of estimated coefficients for the mean
round(coef(garchfit)[1:2], 4)
    mu  archm
0.0002 1.9950
Predicted mean returns
$$ \hat{\mu}_{t} = 0.0002 + 1.9950 \hat{\sigma}^2_{t} $$
Time series plot of predicted returns
- Plot them in R
plot(fitted(garchfit))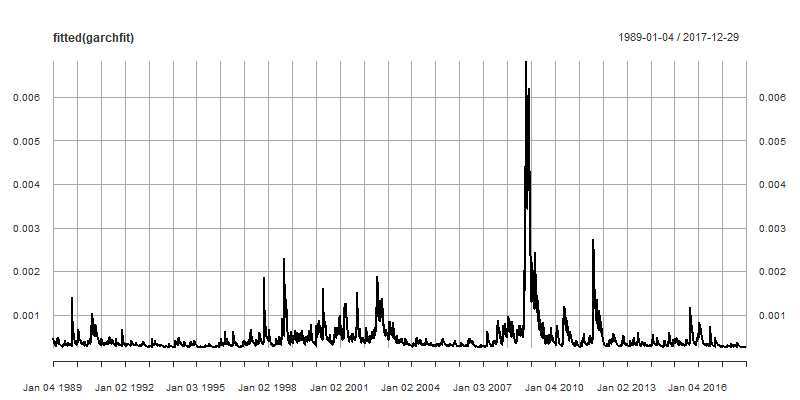
Today's return predicts tomorrow's return
- The GARCH-in-mean uses the financial theory of a risk-reward trade-off to build a conditional mean model.
- Let's now use statistical theory to make a mean model that exploits the correlation between today's return and tomorrow's return.
- The most popular model is the AR(1) model:
- AR(1) stands for autoregressive model of order 1.
- It predicts the next return using the deviation of the return from its long term mean value $\mu$:
$$ \mu_{t} = \mu + \rho(R_{t-1} - \mu) $$
A positive autoregressive coefficient
$$ \mu_{t} = \mu + \rho(R_{t-1} - \mu) $$
- $\rho > 0$:
- A higher (resp. lower) than average return is followed by a higher (resp. lower) than average return.
- Possible explanation: markets underreact to news and hence there is momentum in returns.
- $|\rho|<1$: Mean reversion: The deviations of $R_t$ from $\mu$ are transitory.
A negative autoregressive coefficient
$$ \mu_{t} = \mu + \rho(R_{t-1} - \mu) $$
- $\rho < 0$:
- A higher (resp. lower) than average return is followed by a lower (resp. higher ) than average return.
- Possible explanation: markets overreact to news and hence there is reversal in returns.
Application to daily S&P 500 returns
Specification and estimation of AR(1)-GJR GARCH with sst distribution
garchspec <- ugarchspec(
          mean.model = list(armaOrder = c(1, 0)),
          variance.model = list(model = "gjrGARCH"),
          distribution.model = "sstd")
garchfit <- ugarchfit(data = sp500ret, spec = garchspec)
Estimates of the AR(1) model
round(coef(garchfit)[1:2], 4)
     mu     ar1
 0.0003 -0.0292
MA(1) and ARMA(1,1) model
The Moving Average model of order 1 uses the deviation of the return from its conditional mean:
$$ \mu_{t} = \mu + \theta(R_{t-1} - \mu_{t-1}) $$
ARMA(1,1) combines AR(1) and MA(1):
$$ \mu_{t} = \mu + \rho(R_{t-1} - \mu) + \theta(R_{t-1} - \mu_{t-1}) $$
How?
MA(1)
garchspec <- ugarchspec(
          mean.model = list(armaOrder = c(0, 1)),
          variance.model = list(model = "gjrGARCH"),
          distribution.model = "sstd")
ARMA(1, 1)
garchspec <- ugarchspec(
          mean.model = list(armaOrder = c(1, 1)),
          variance.model = list(model = "gjrGARCH"),
          distribution.model = "sstd")
Your turn to change the mean.model argument
GARCH Models in R

