Value-at-risk

GARCH Models in R

Kris Boudt

Professor of finance and econometrics
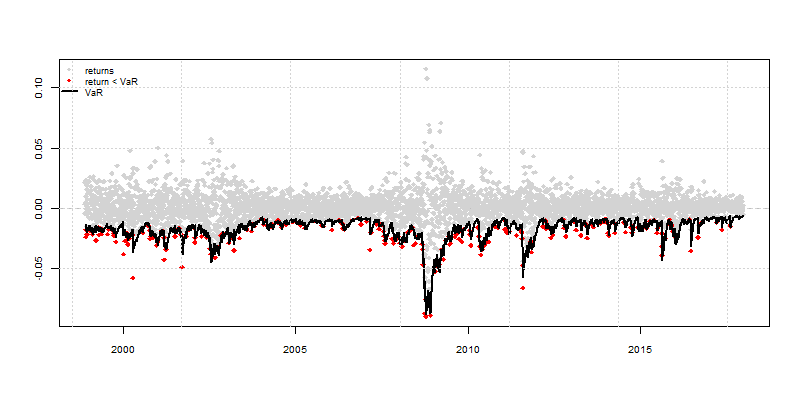
Value-at-risk

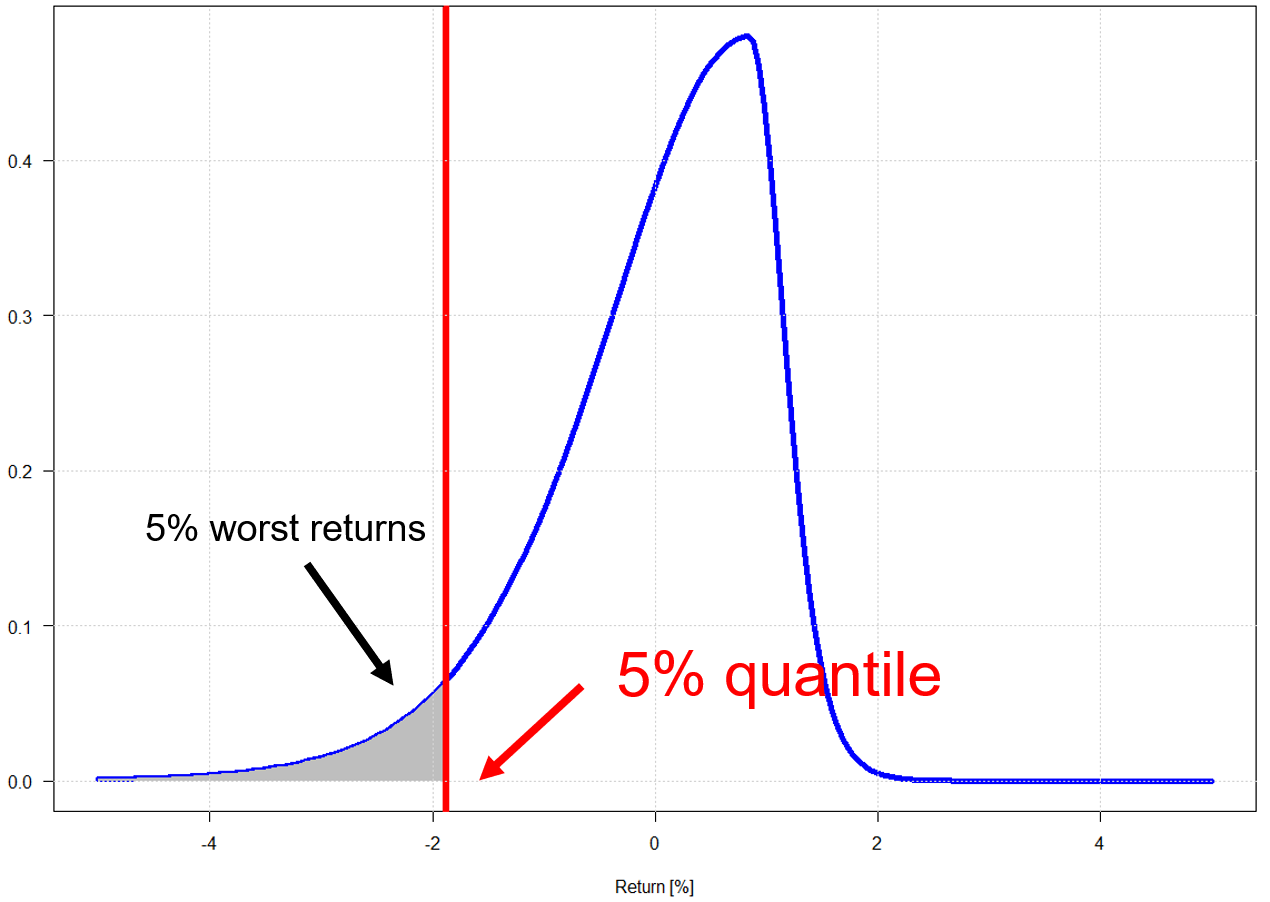
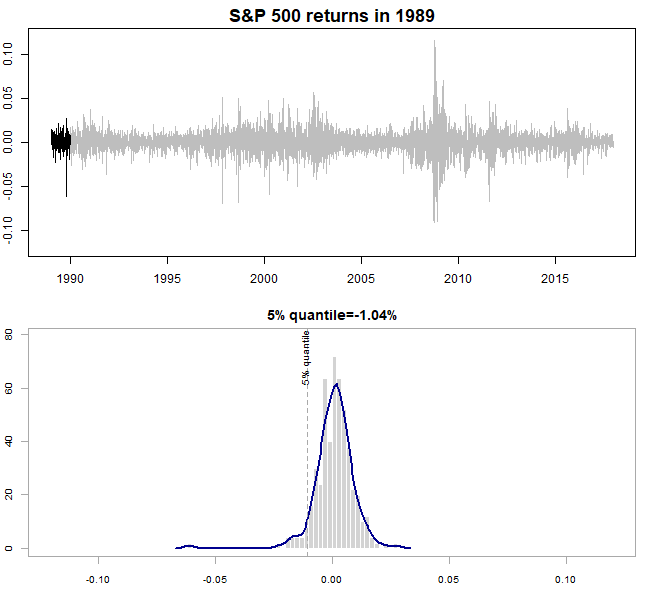
  • A popular measure of downside risk: 5% value-at-risk. The 5% quantile of the return distribution represents the best return in the 5% worst scenarios.
    Distribution of daily returns per year
GARCH Models in R

Distribution of daily returns per year

GARCH Models in R

Forward looking approach is needed

  • Quantiles of rolling windows of returns are backward looking:
    • ex post question: what has the 5% quantile been for the daily returns over the past year
    • ex ante question: what is the 5% quantile of the predicted distribution of the future return?
  • Forward looking risk management uses the predicted quantiles from the GARCH estimation.
  • How? Method quantile() applied to a ugarchroll object.
GARCH Models in R

Workflow to obtain predicted 5% quantiles from ugarchroll

ugarchspec(): Specify which GARCH model you want to use

garchspec <- ugarchspec(mean.model = list(armaOrder = c(1, 0)),
                        variance.model = list(model = "gjrGARCH"),
                        distribution.model = "sstd")

ugarchroll(): Estimate the GARCH model on rolling estimation samples

garchroll <- ugarchroll(garchspec, data = sp500ret, n.start = 2500, 
                        refit.window = "moving", refit.every = 100)

quantile(): Compute the predicted quantile

garchVaR <- quantile(garchroll, probs = 0.05)

You can choose another loss probability: 1% and 2.5% are also popular

GARCH Models in R

Value-at-risk plot for loss probability 5%

actual <- xts(as.data.frame(garchroll)$Realized, time(garchVaR))
VaRplot(alpha = 0.05, actual = actual, VaR = garchVaR)

Distribution of daily returns per year

GARCH Models in R

Exceedance and VaR coverage

A VaR exceedance occurs when the actual return is less than the predicted value-at-risk: $ R_t \ < {VaR}_t$.

The frequency of VaR exceedances is called the VaR coverage.

# Calculation of coverage for S&P 500 returns and 5% probability level
mean(actual < garchVaR)
0.05159143
GARCH Models in R

VaR coverage and model validation

  • Interpretation of coverage for VaR at loss probability $\alpha$ (e.g., 5%):
    • Valid prediction model has a coverage that is close to the probability level $\alpha$ used.
    • If coverage $\gg$ $\alpha$: too many exceedances: the predicted quantile should be more negative. Risk of losing money has been underestimated.
    • If coverage $\ll$ $\alpha$: too few exceedances, the predicted quantile was too negative. Risk of losing money has been overestimated.
GARCH Models in R

Factors that deteriorate the performance

distribution.model = "std" instead of distribution.model = "sstd":

garchspec <- ugarchspec(mean.model = list(armaOrder = c(1, 0)),
                        variance.model = list(model = "gjrGARCH"),
                        distribution.model = "std")

Rolling estimation and 5% VaR prediction:

garchroll <- ugarchroll(garchspec, data = sp500ret, n.start = 2500, 
                        refit.window = "moving", refit.every = 100)
garchVaR <- quantile(garchroll, probs = 0.05)
mean(actual < garchVaR) # returns 0.05783233
GARCH Models in R

Further deterioration

variance.model = list(model = "sGARCH")

instead of

variance.model = list(model = "gjrGARCH"):

garchspec <- ugarchspec(mean.model = list(armaOrder = c(1, 0)),
                        variance.model = list(model = "sGARCH"),
                        distribution.model = "std")

Rolling estimation and 5% VaR prediction:

garchroll <- ugarchroll(garchspec, data = sp500ret, n.start = 2500, 
                        refit.window = "moving", refit.every = 100)
garchVaR <- quantile(garchroll, probs = 0.05)
mean(actual < garchVaR) # returns 0.06074475
GARCH Models in R

Even further deterioration

refit.every = 1000

instead of

refit.every = 100:

garchspec <- ugarchspec(mean.model = list(armaOrder = c(1, 0)),
                        variance.model = list(model = "sGARCH"),
                        distribution.model = "std")
garchroll <- ugarchroll(garchspec, data = sp500ret, n.start = 2500, 
                        refit.window = "moving", refit.every = 1000)
garchVaR <- quantile(garchroll, probs = 0.05)
mean(actual < garchVaR) # returns 0.06199293
GARCH Models in R

Downside risk means thinking about predicted quantiles.

GARCH Models in R

Preparing Video For Download...