GARCH Models in R
Kris Boudt
Professor of finance and econometrics
Change the argument distribution.model of ugarchspec() from "norm" to "sstd":
distribution.model
ugarchspec()
"norm"
"sstd"
garchspec <- ugarchspec( mean.model = list(armaOrder = c(0, 0)),
                         variance.model = list(model = "sGARCH"),
                         distribution.model = "norm")
$$ \downarrow$$
garchspec <- ugarchspec( mean.model = list(armaOrder = c(0, 0)),
                         variance.model = list(model = "sGARCH"),
                         distribution.model = "sstd")
Under the model assumptions
$$ R_{t} = \mu_{t} + e_{t} $$ $$ e_{t} \sim N(0, \sigma^{2}_{t}) $$
it follows that
$$ \frac{R_{t} - \mu_{t}}{\sigma_{t}} \sim N(0, 1) $$
$$ Z_{t} = \frac{R_{t} - \hat{\mu_{t}}}{ \hat{\sigma_{t}}} $$
Calculation in R
# Obtain standardized returns
stdret <- residuals(garchfit, standardize = TRUE)
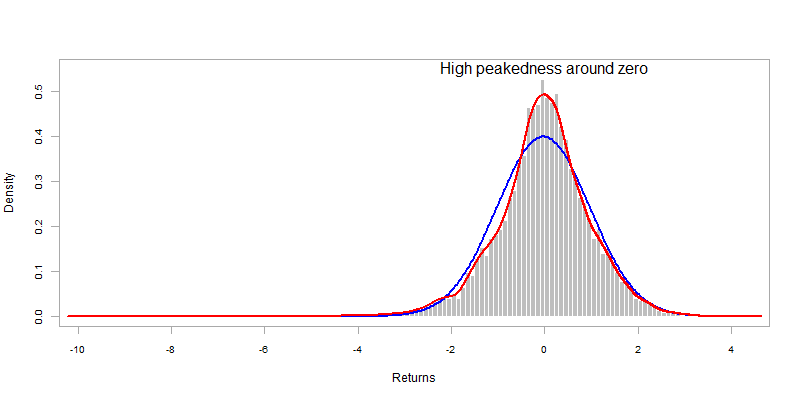
library(PerformanceAnalytics)
chart.Histogram(sp500ret, methods = c("add.normal", "add.density"),
          colorset = c("gray", "red", "blue"))
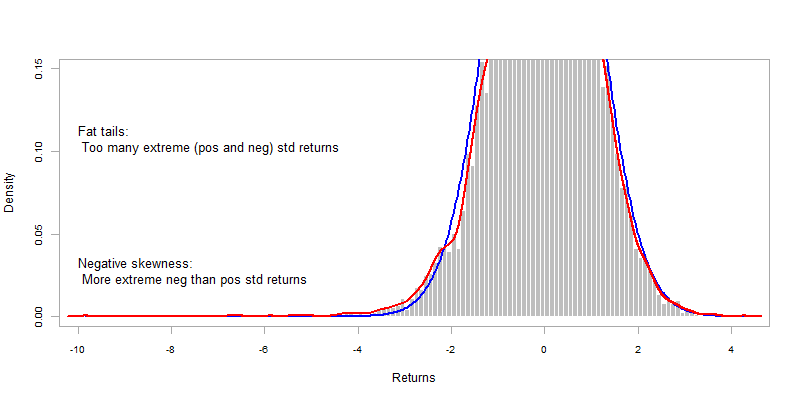
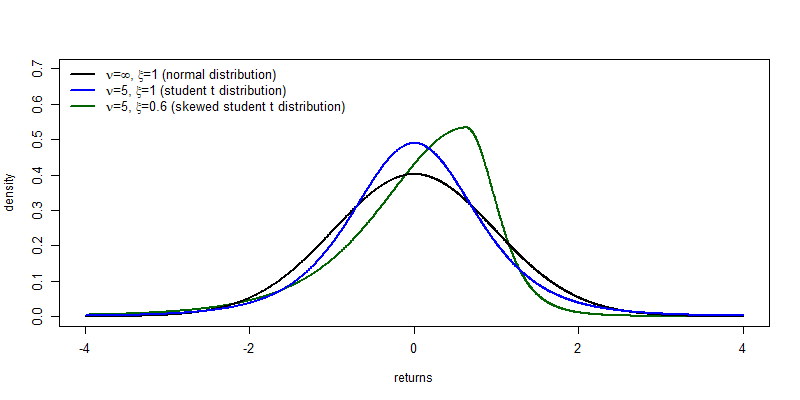
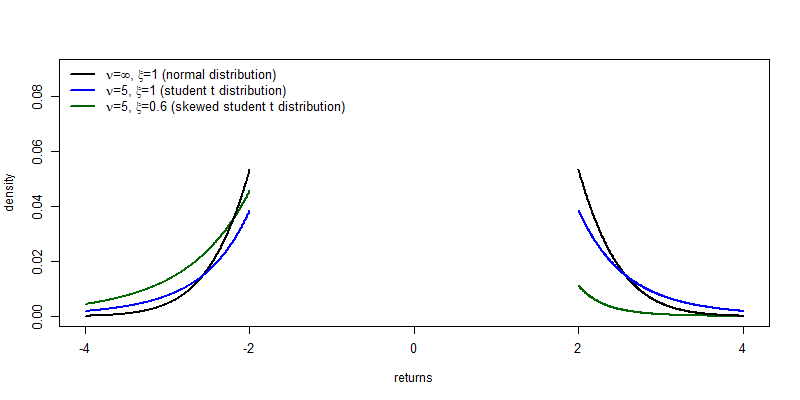
A realistic distribution thus needs to accommodate the presence of
In rugarch this is possible with the skewed student t distribution:
rugarch
garchspec <- ugarchspec(distribution.model = "sstd")
Compared to the normal distribution, the skewed student t distribution has two extra parameters:
shape
skew
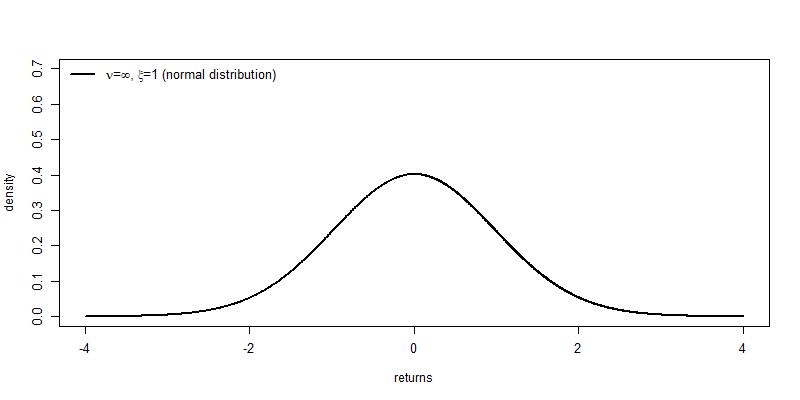
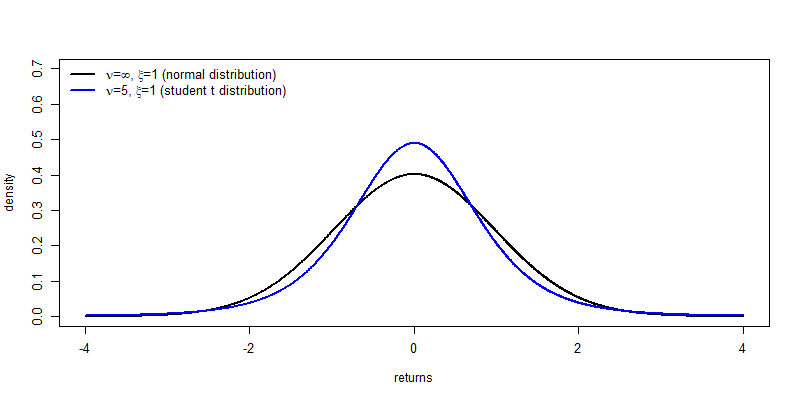
Special cases:
Set argument distribution.model to "sstd"
garchspec <- ugarchspec(mean.model = list(armaOrder = c(0,0)),
                        variance.model = list(model = "sGARCH"),
                        distribution.model = "sstd")
Estimate the model
garchfit <- ugarchfit(data = sp500ret, spec = garchspec)
coef(garchfit)
          mu        omega       alpha1        beta1         skew        shape
5.669200e-04 6.281258e-07 7.462984e-02 9.223701e-01 9.436331e-01 6.318621e+00