Leverage effect

GARCH Models in R

Kris Boudt

Professor of finance and econometrics

Negative returns induce higher leverage

  • $R_t <0 $
  • $\downarrow$ market value
  • $\uparrow$ leverage = debt / market value
  • $\uparrow$ volatility
GARCH Models in R

Two equations

Use separate equations for the variance following negative and positive unexpected return $e_t = R_t - \mu_t$ :

Case when $ e_{t-1} \gt 0$

$$ \sigma^2_{t} = ??? $$

Case when $ e_{t-1} \le 0$

$$ \sigma^2_{t} = ??? $$

GARCH Models in R

In case of a positive surprise

... we take the usual GARCH(1,1) equation:

Case when $ e_{t-1} \gt 0$

$$ \sigma^2_{t} = \omega + \alpha e^{2}_{t-1} + \beta \sigma^{2}_{t-1} $$

Case when $ e_{t-1} \le 0$

$$ \sigma^2_{t} = ??? $$

GARCH Models in R

In case of a negative surprise

  • The predicted variance should be higher than after a positive surprise.

  • This means a higher coefficient multiplying the squared prediction error, namely $\alpha+\gamma$ instead of $\alpha$ with $\gamma \geq 0$

Case when $ e_{t-1} \gt 0$

$$ \sigma^2_{t} = \omega + \alpha e^{2}_{t-1} + \beta \sigma^{2}_{t-1} $$

Case when $ e_{t-1} \le 0$

$$ \sigma^2_{t} = \omega + (\alpha + \gamma) e^{2}_{t-1} + \beta \sigma^{2}_{t-1} $$

This is the GJR model proposed Glosten, Jagannathan and Runkle.

GARCH Models in R

How?

Change the argument variance.model of ugarchspec() from model = "sGARCH" to model = "gjrGARCH":

garchspec <- ugarchspec(mean.model = list(armaOrder = c(0, 0)),
                         variance.model = list(model = "sGARCH"),
                         distribution.model = "sstd") 

$$\downarrow$$

garchspec <- ugarchspec(mean.model = list(armaOrder = c(0, 0)), 
                        variance.model = list(model = "gjrGARCH"),
                        distribution.model = "sstd")
GARCH Models in R

Illustration on MSFT returns

Estimate the model

garchfit <- ugarchfit(data = msftret, spec = garchspec)

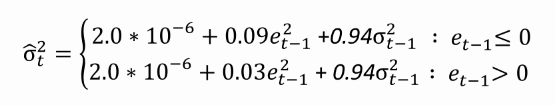
Inspect the GARCH coefficients

coef(garchfit)[2:5]
       omega       alpha1        beta1       gamma1 
2.007875e-06 3.423336e-02 9.363302e-01 5.531854e-02

GARCH Models in R

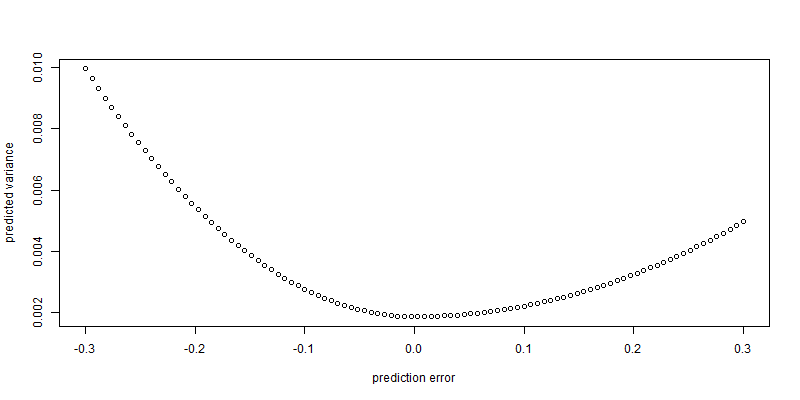
Visualize volatility response using newsimpact()

out <- newsimpact(garchfit)
plot(out$zx, out$zy, xlab = "prediction error", ylab = "predicted variance")

GARCH Models in R

Let's estimate a GJR GARCH model.

GARCH Models in R

Preparing Video For Download...