Validate your assumptions about the mean and variance
GARCH Models in R

Kris Boudt
Professor of finance and econometrics
Check 1: Mean and standard deviation of standardized returns
Formula standardized returns
$$ Z_{t} = \frac{R_{t} - \hat{\mu_{t}}}{ \hat{\sigma_{t}}} $$
- First check of model validity:
- Sample mean of standardized returns $\approx$ 0
- Sample standard deviation of standardized returns $\approx$ 1
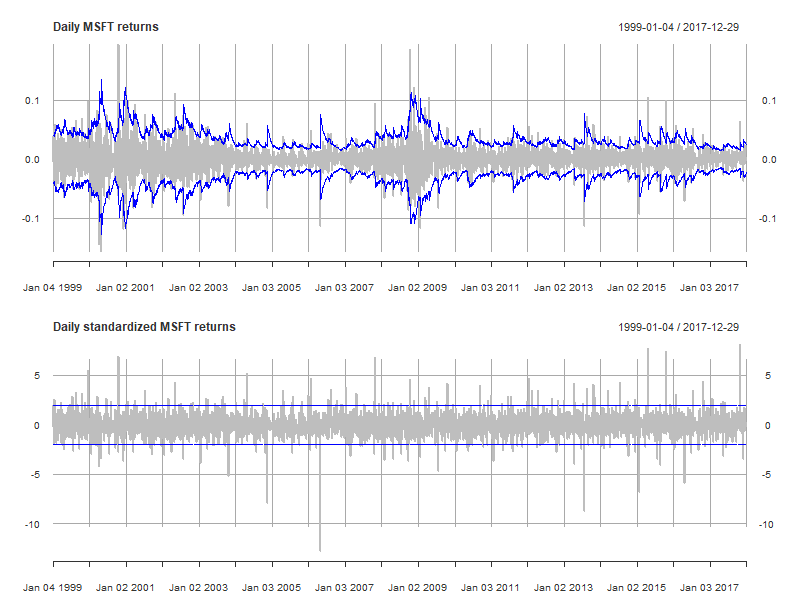
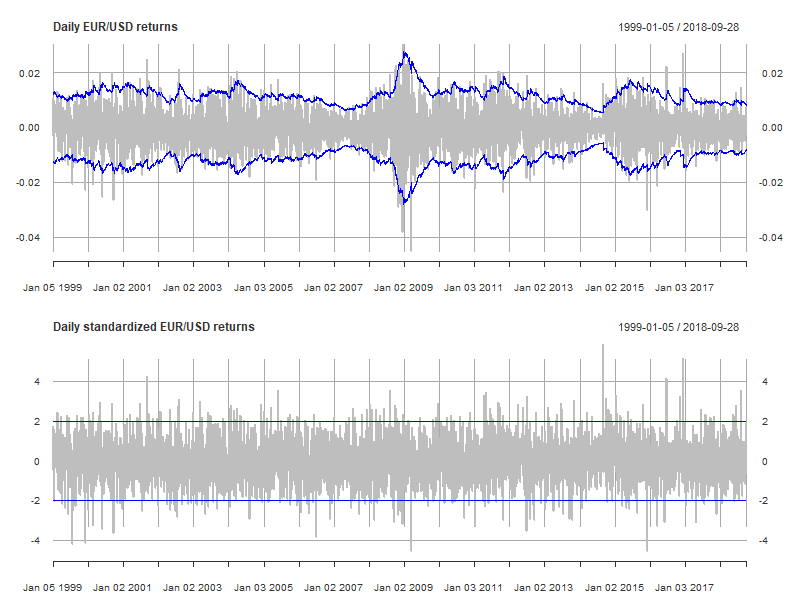
Check 2: Time series plot of standardized returns
- Second check of model validity:
- time series plot of standardized returns
- standardized returns should have constant variability
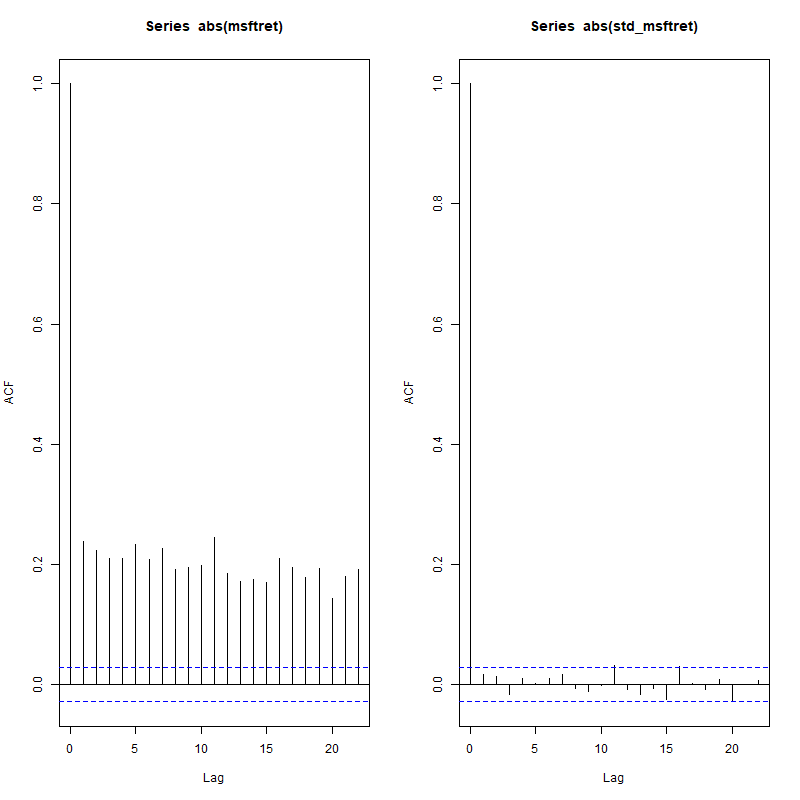
Check 3: No predictability in the absolute standardized returns
Third check of model validity:
- verify that there is no correlation between the past absolute standardized return and the current absolute standardized return.
- this means: $ Corr(|Z_{t-k}|, |Z_{t}|) \approx 0, $ for $k>0$
Why?
- The magnitude of the absolute standardized return should be constant $\rightarrow$ no correlations in the absolute standardized returns.
Autocorrelations
- Such within time series correlations are called autocorrelations of order k
- $k=1$: $Corr(|Z_{t-1}|, |Z_{t}|)$: Correlation of the current absolute standardized return and its previous value.
- $k=2$: $Corr(|Z_{t-2}|, |Z_{t}|)$: Correlation of the current absolute standardized return and its value two periods ago.
- ...
- All of these should be 0. Except:
- $k=0$: $Corr(|Z_{t}|, |Z_{t}|)$: Correlation of the absolute standardized return with itself: equals 1.
acf()
- In R, we can compute those autocorrelations using the autocorrelation function denoted by
acf()- Input: Time series, maximum order
- Output: The correlogram: plot showing the values of the autocorrelation for different orders $k = 0, 1, ...$.
Application to MSFT
garchspec <- ugarchspec(mean.model = list(armaOrder = c(1, 0)),
                        variance.model = list(model = "gjrGARCH"),
                        distribution.model = "sstd")
garchfit <- ugarchfit(data = msftret, spec = garchspec)
stdmsftret <- residuals(garchfit, standardize = TRUE)
acf(abs(msftret), 22)
acf(abs(stdmsftret), 22)
Check 4: Ljung-Box test
- Fourth check of model validity:
- Ljung-Box test that the first k autocorrelations in the absolute standardized returns $|Z_t$| are zero: $$ H_0: Corr(|Z_t|,|Z_{t-1}|) = Corr(|Z_t|,|Z_{t-2}|) = ... = Corr(|Z_t|,|Z_{t-k}|) = 0 $$
- Similar to a $t$-test for statistical significance of the estimated parameters, but here we want to have 0 in order to have a good model.
Rule of thumb: p-value less than 5% indicates that the model used is not valid.
Ljung-Box test in R
- In R: function
Box.test()with 3 arguments:- series
- maximum order for which autocorrelations are zero
type = "Ljung-Box"
Example:
Box.test(abs(stdmsftret), 22, type = "Ljung-Box")
- Output: p-value
- Rule of thumb: p-value less than 5% indicates that the model used is not valid.
Box.test using absolute standardized MSFT returns
Test on absolute standardized returns:
Box.test(abs(stdmsftret), 22, type = "Ljung-Box")
    Box-Ljung test
data:  abs(stdmsftret)
X-squared = 25.246, df = 22, p-value = 0.2855
Note: p-value is 28.55% > 5%. We cannot reject that: $$ H_0: Corr(|Z_t|,|Z_{t-1}|) = Corr(|Z_t|,|Z_{t-2}|) = ... = Corr(|Z_t|,|Z_{t-22}|) = 0 $$
Let's diagnose the absolute standardized returns.
GARCH Models in R

