Dimensions of portfolio performance
Introduction to Portfolio Analysis in R

Kris Boudt
Professor, Free University Brussels & Amsterdam
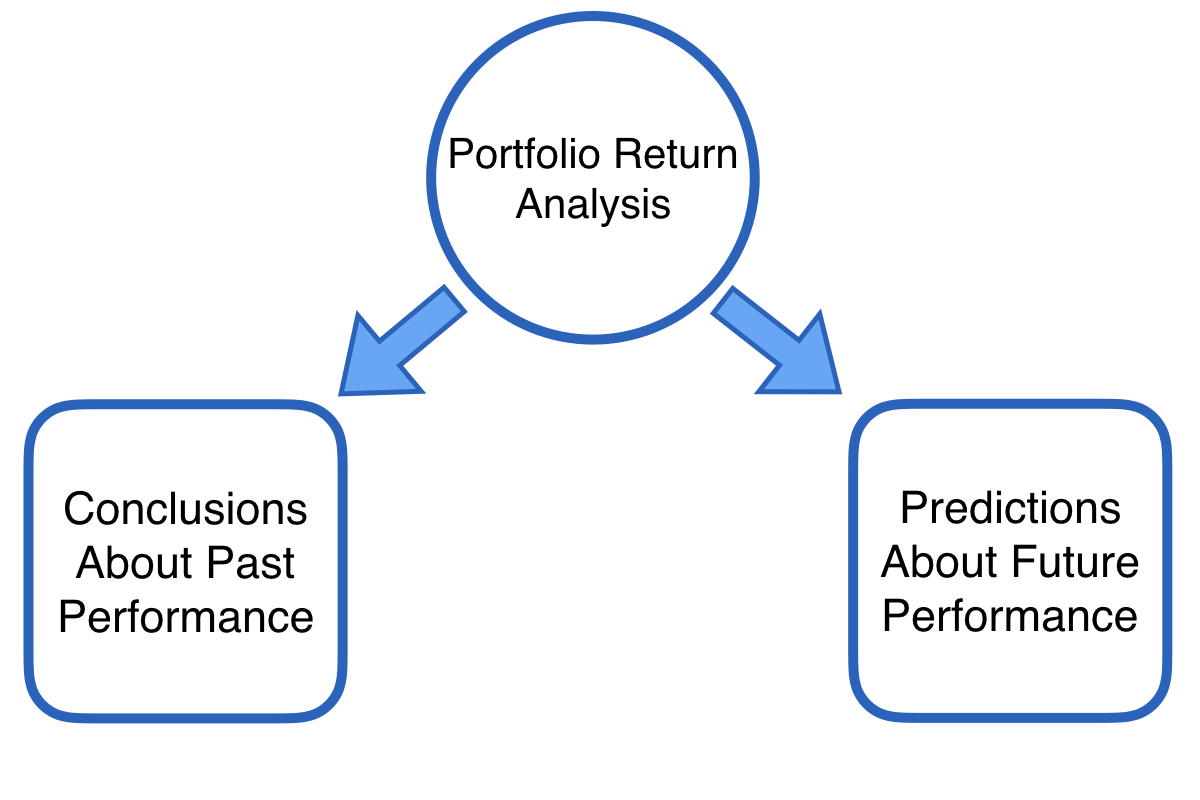
Interpretation of portfolio returns
Interpretation of portfolio returns
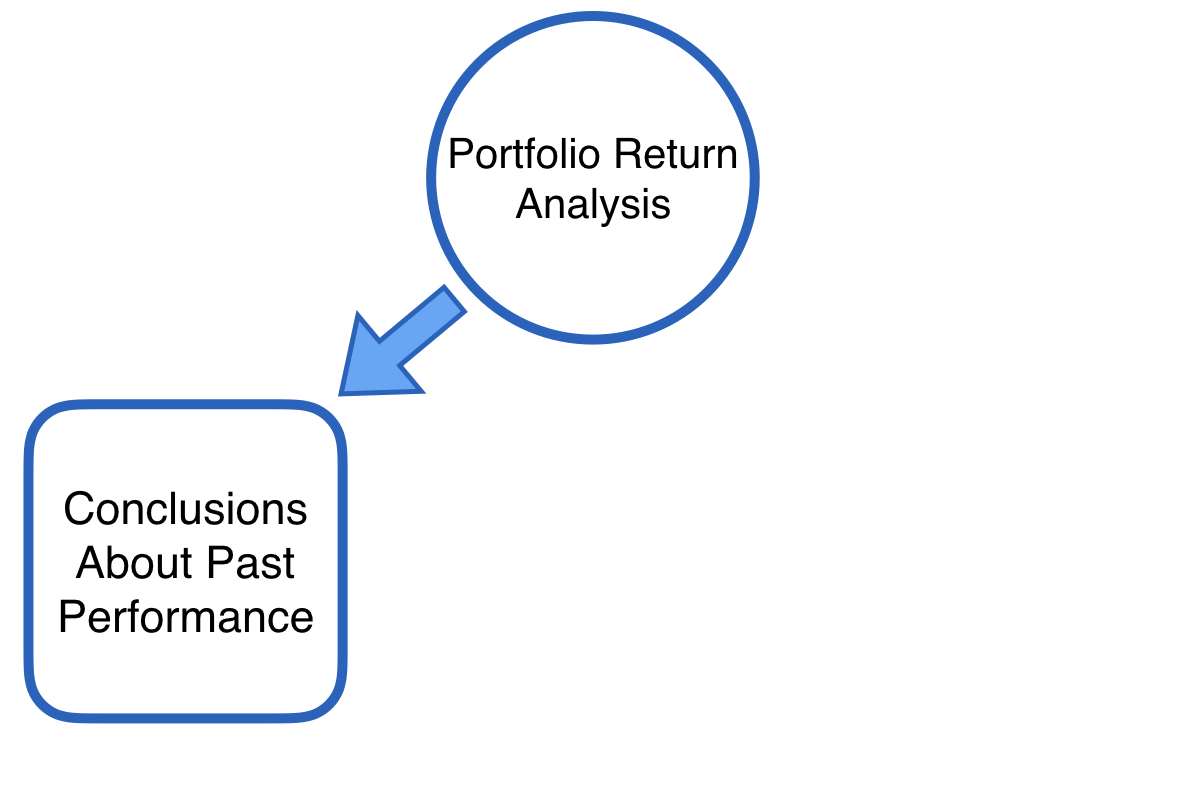
Interpretation of portfolio returns
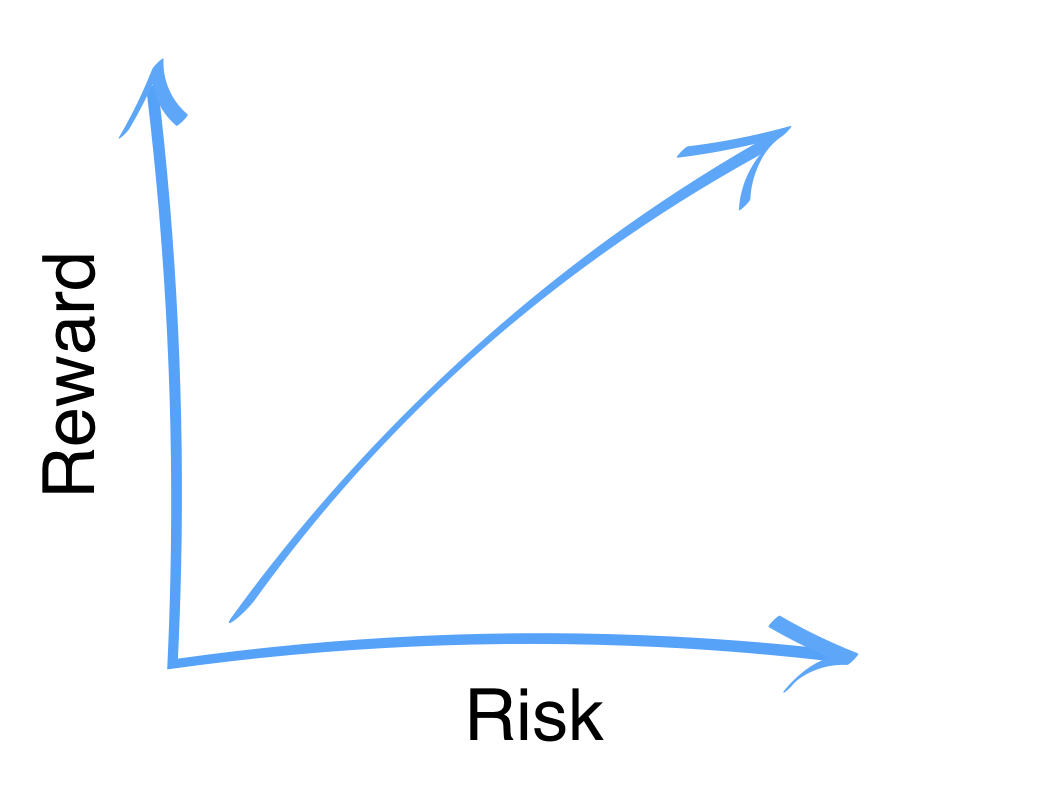
Risk vs. reward
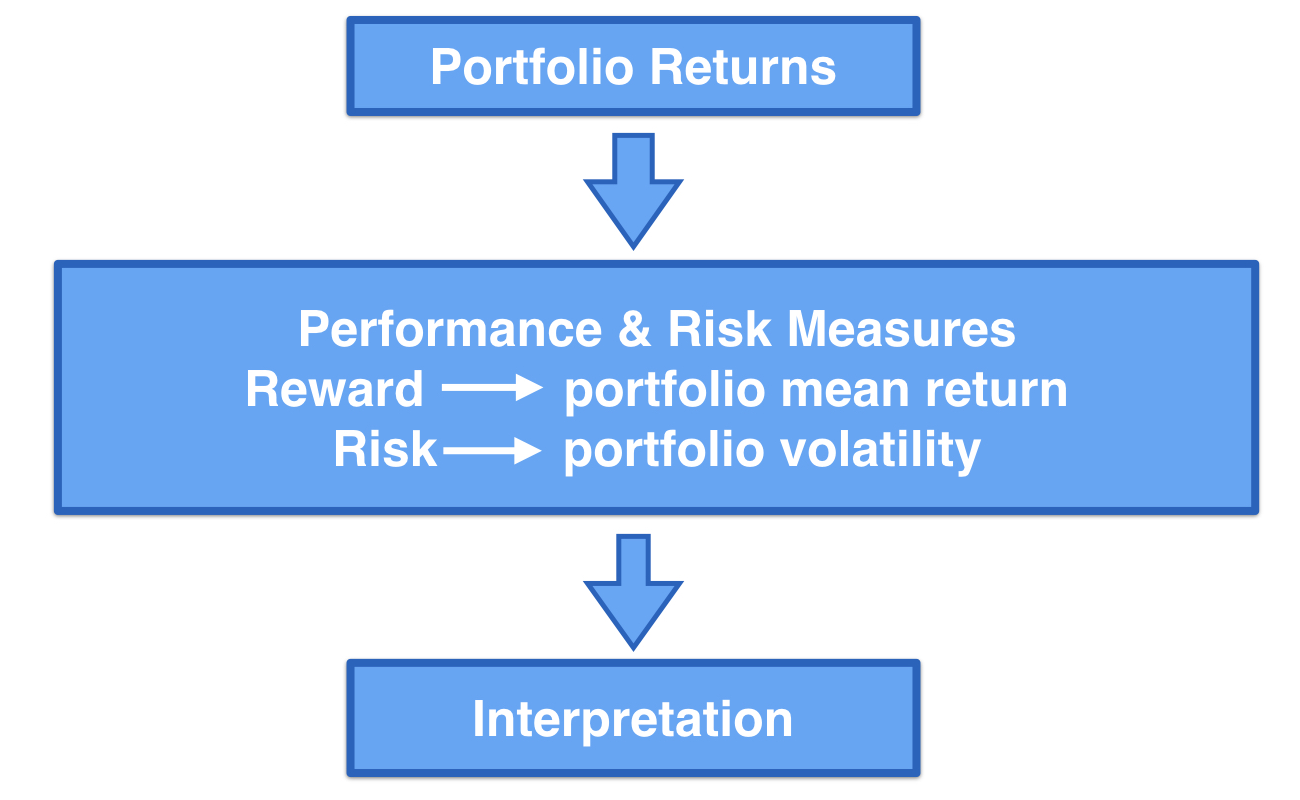
Need for performance measure
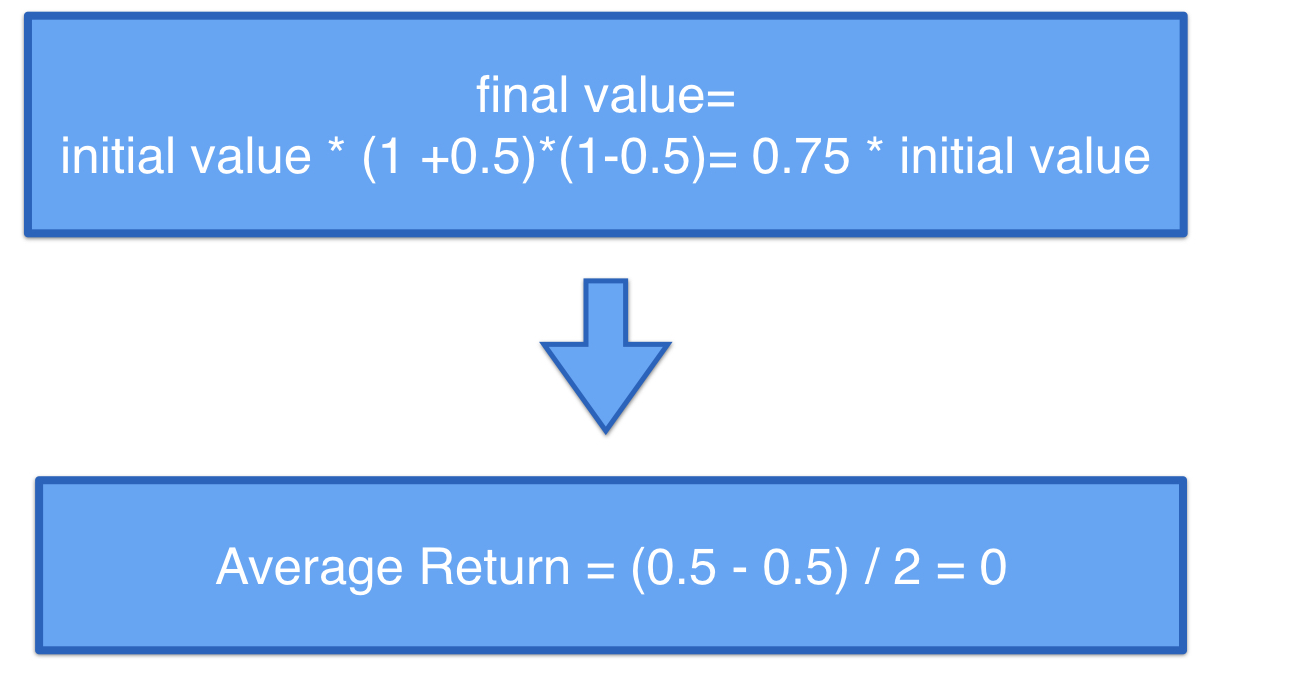
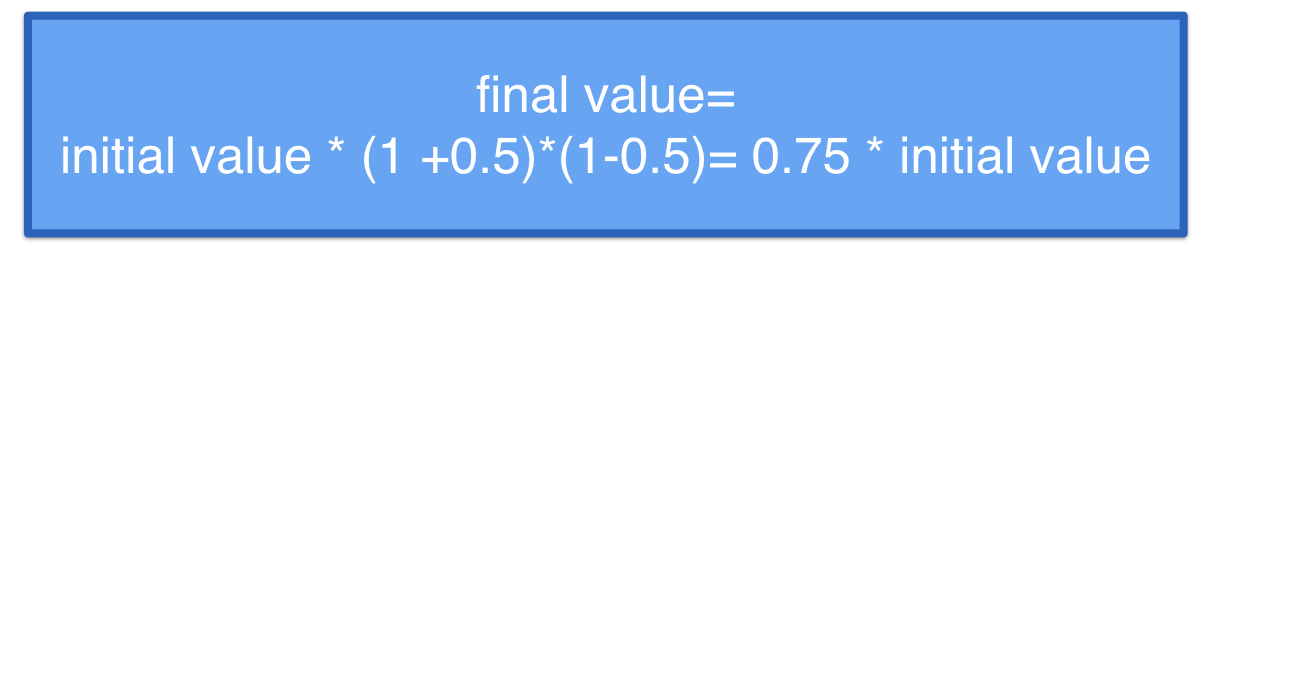
No linear compensation in return
- Mismatch between average return and effective return
No linear compensation in return
- Mismatch between average return and effective return
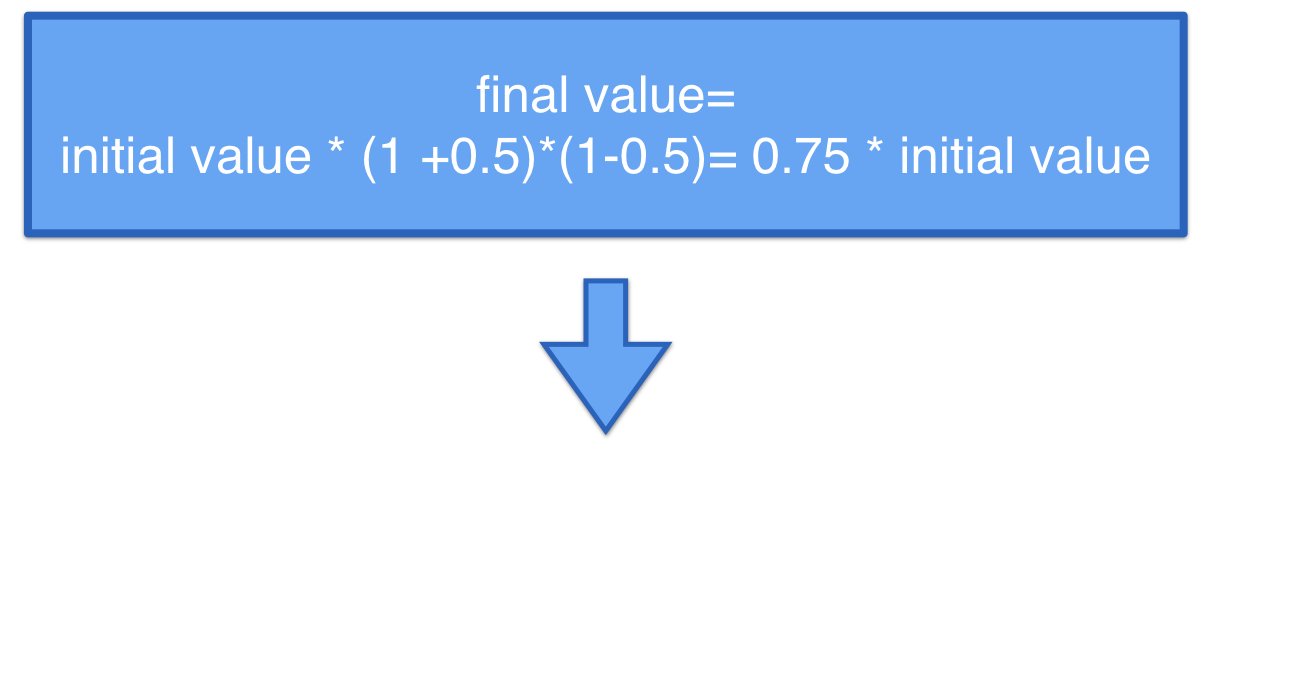
No linear compensation in return
- Mismatch between average return and effective return