Non-normality of the return distribution
Introduction to Portfolio Analysis in R

Kris Boudt
Professor, Free University Brussels & Amsterdam
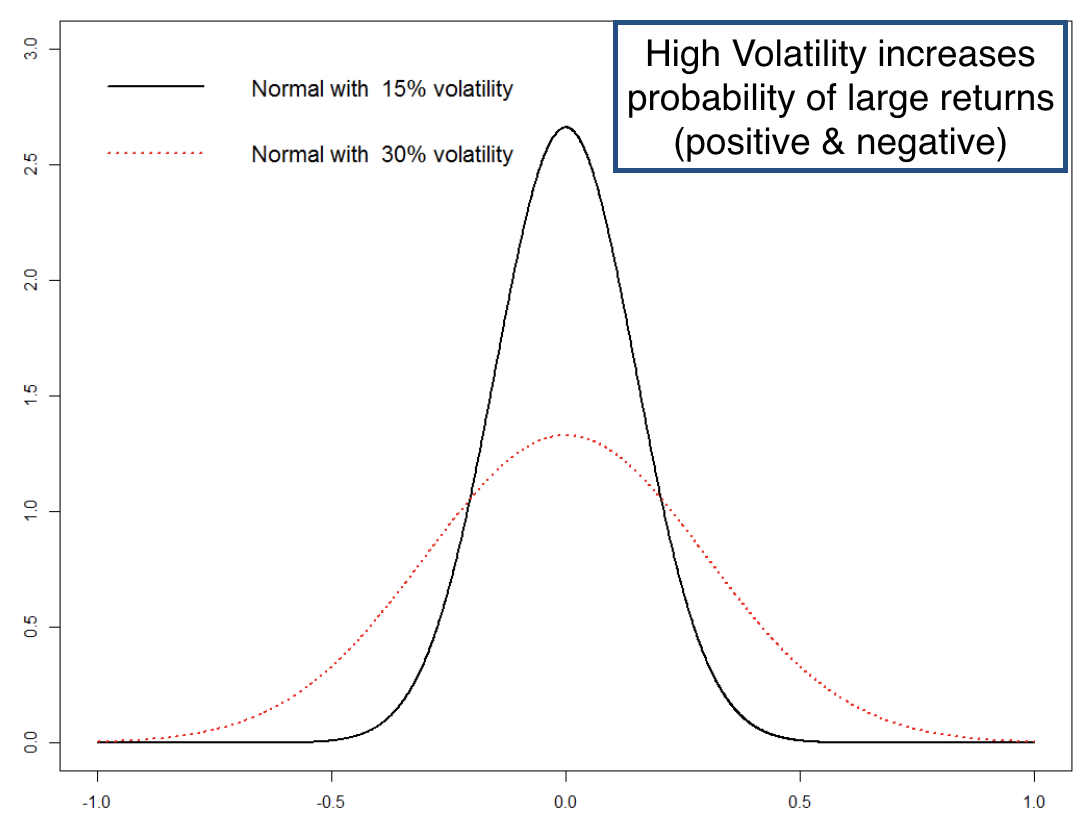
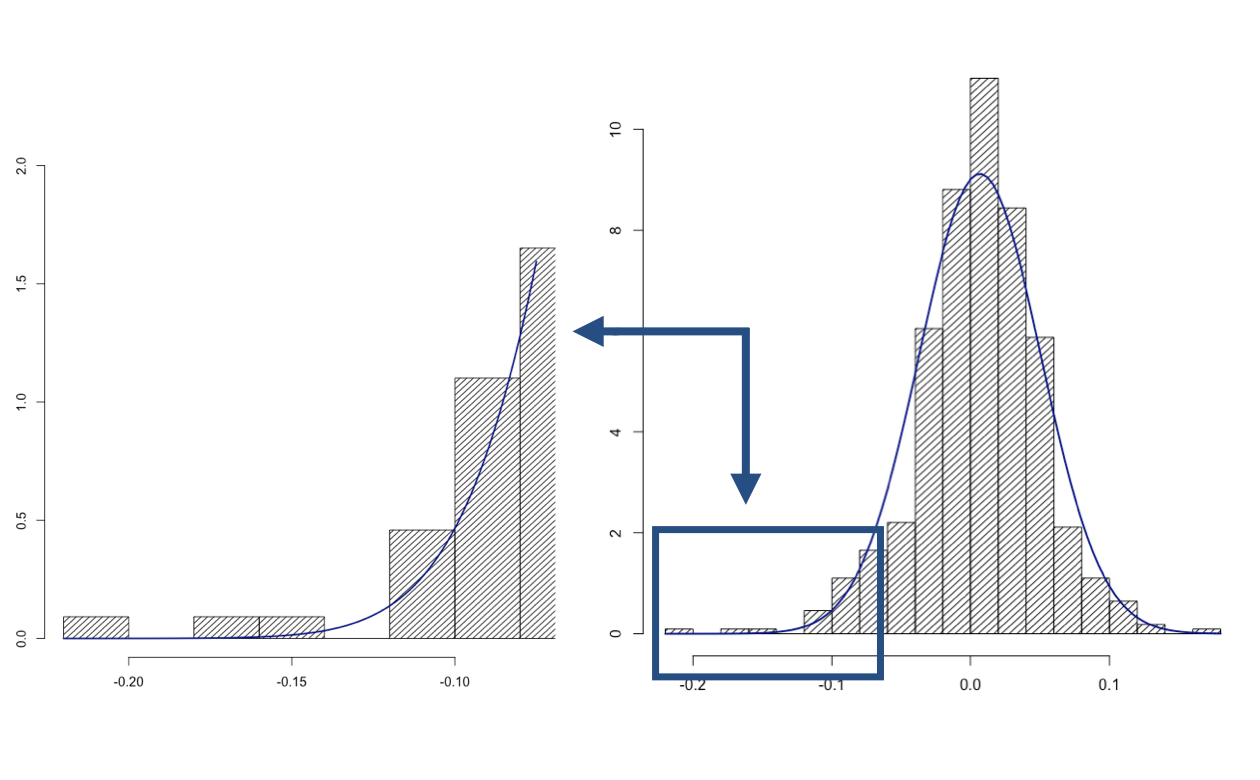
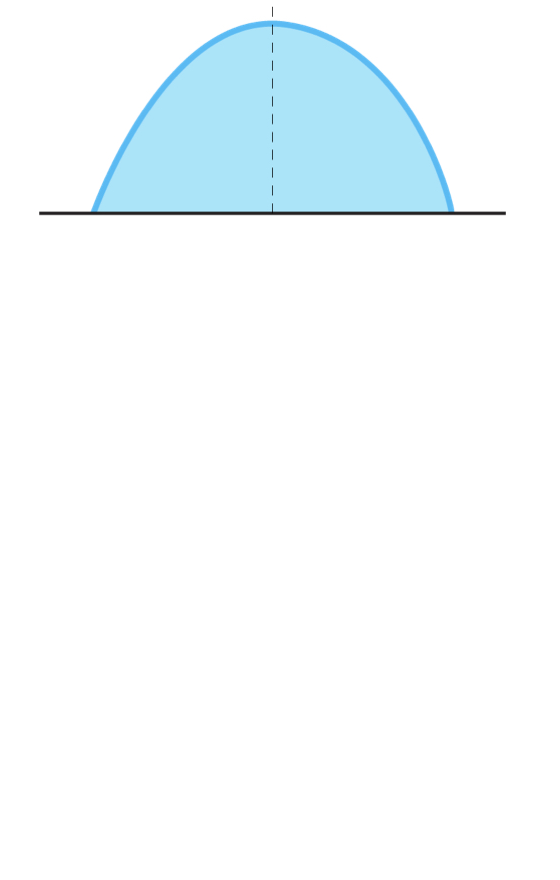
Volatility describes "normal" risk
Non-normality of return
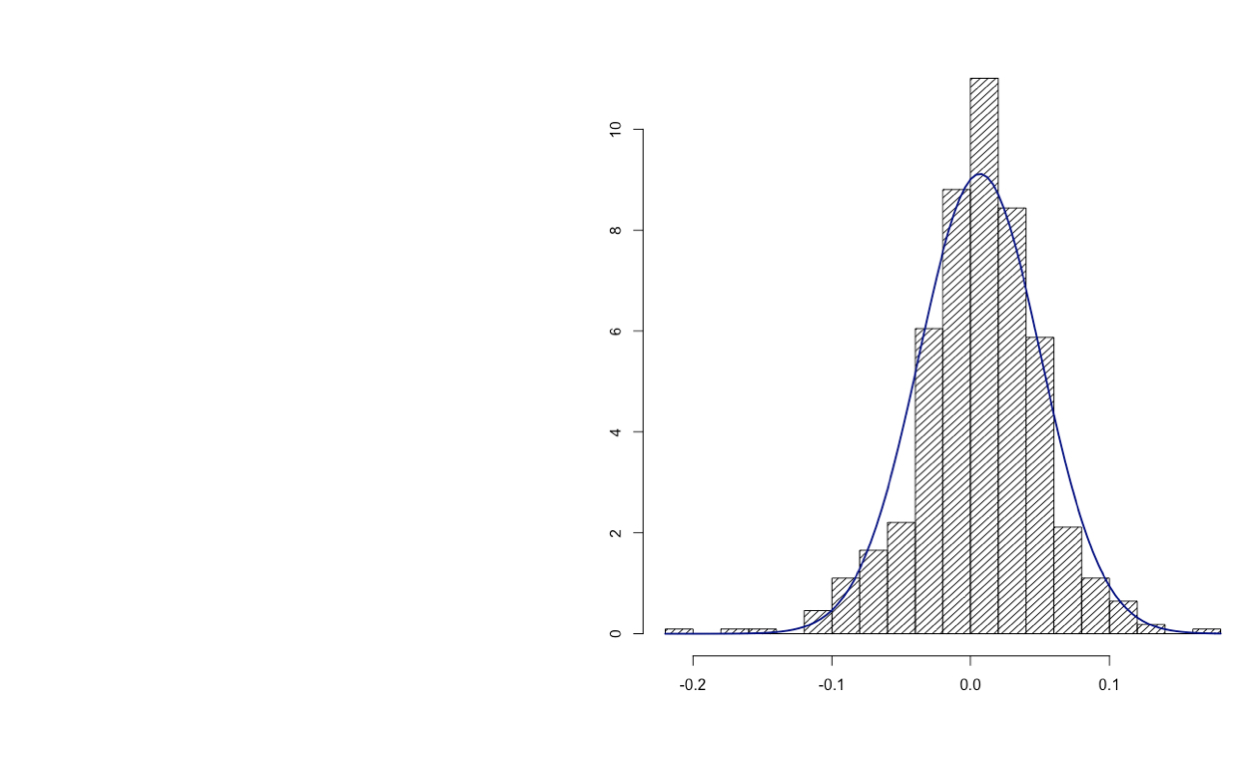
Non-normality of return
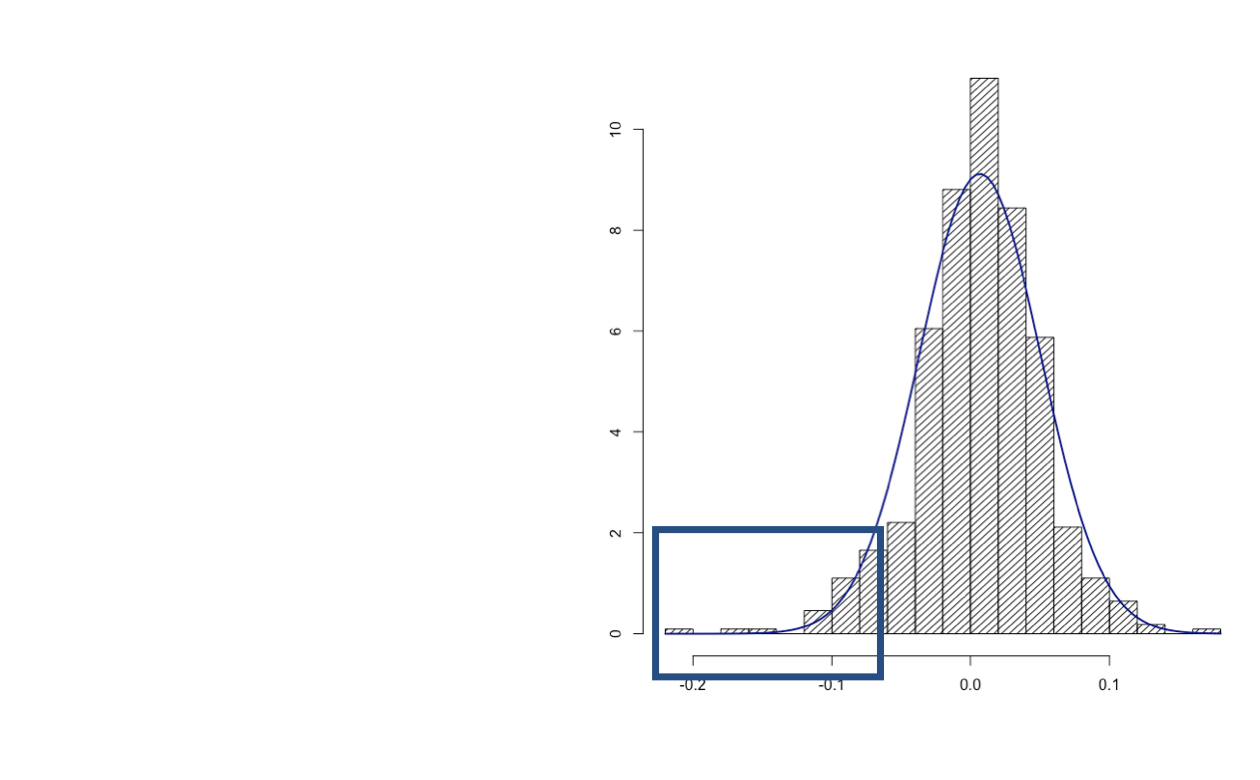
Non-normality of return
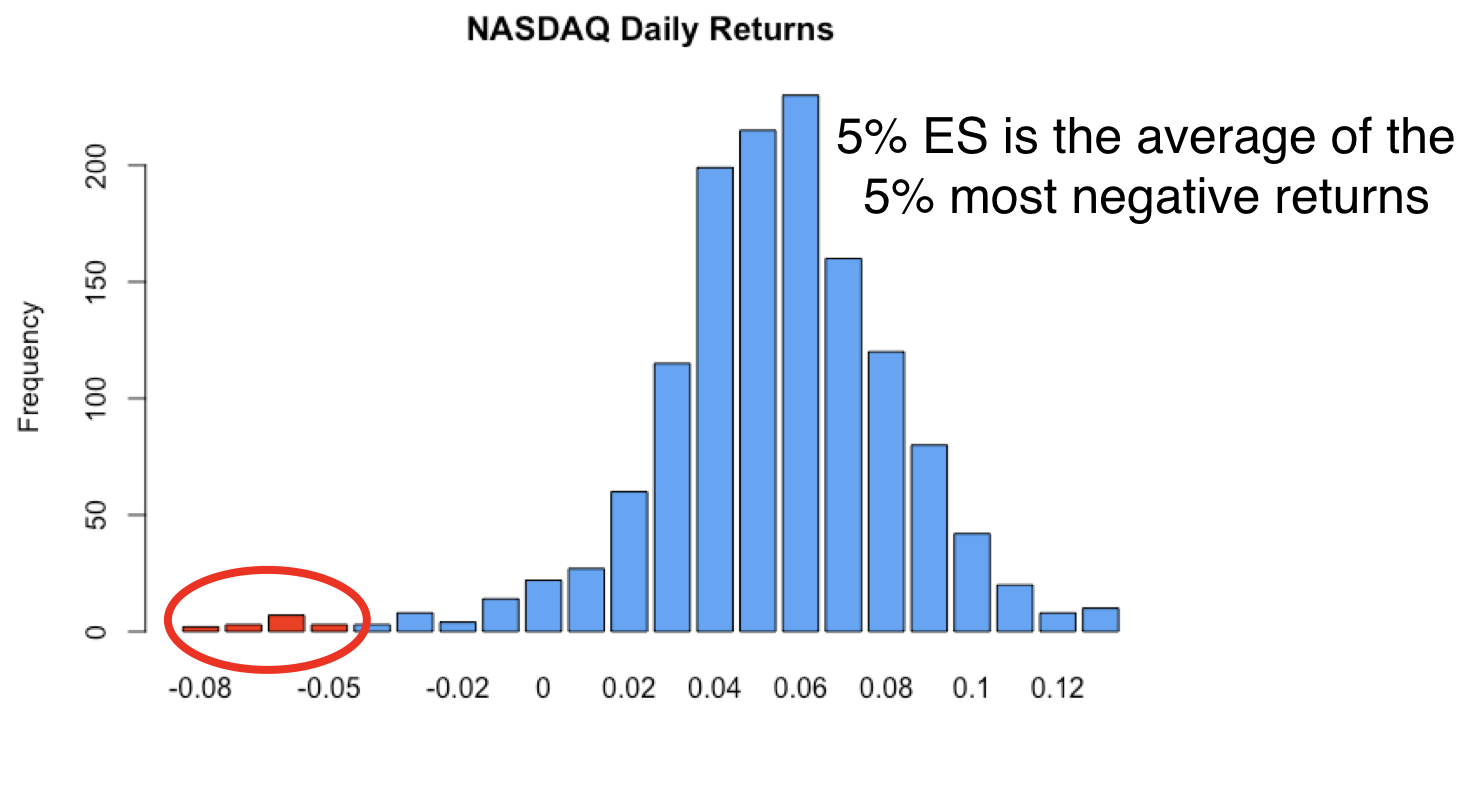
Value-at-risk & expected shortfall
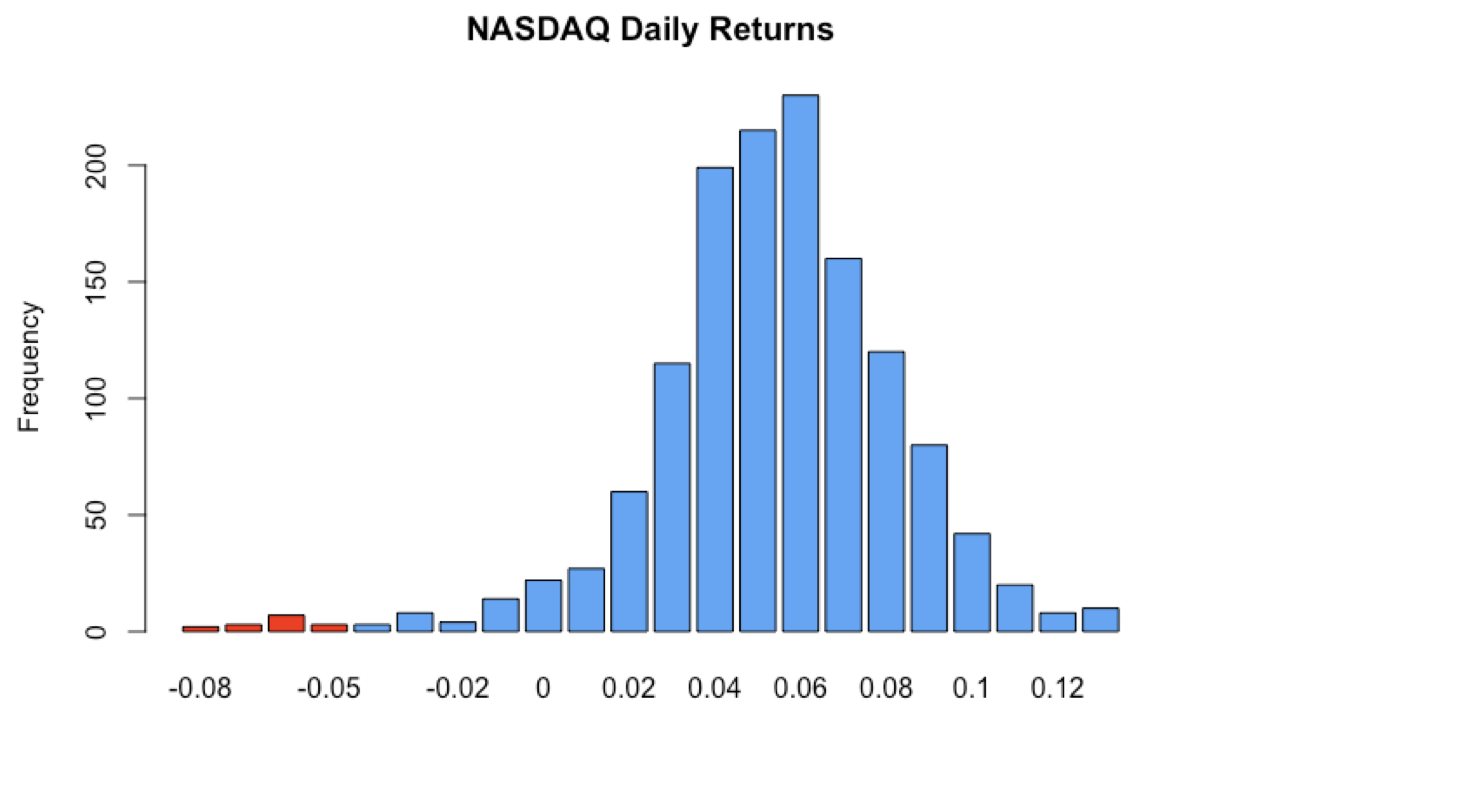
Value-at-risk & expected shortfall
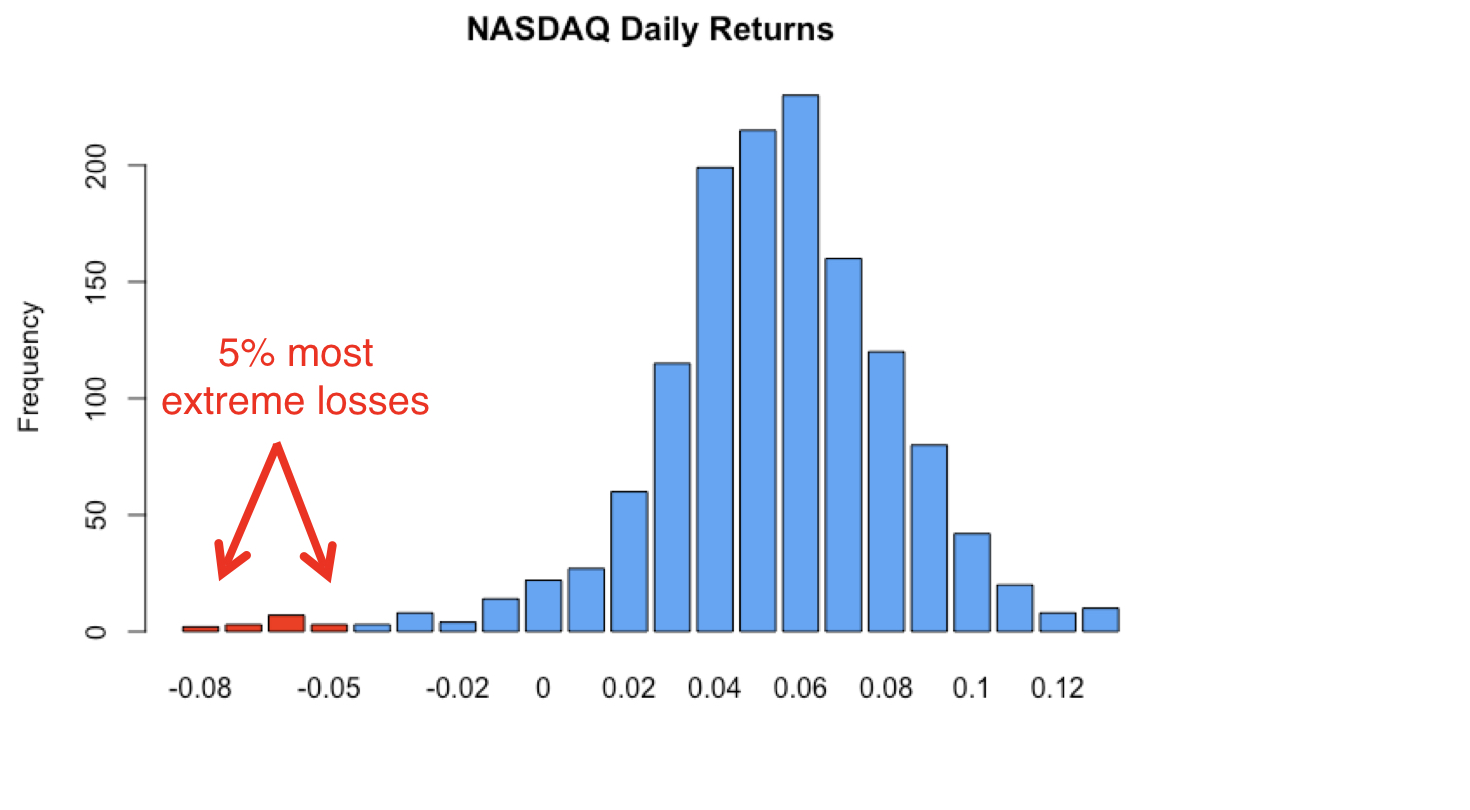
Value-at-risk & expected shortfall

Value-at-risk & expected shortfall
Skewness
Skewness
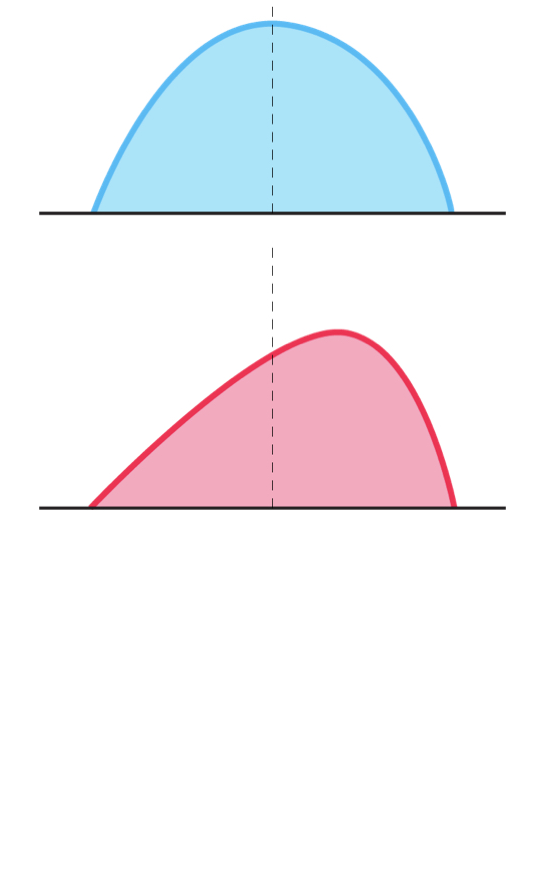
Skewness
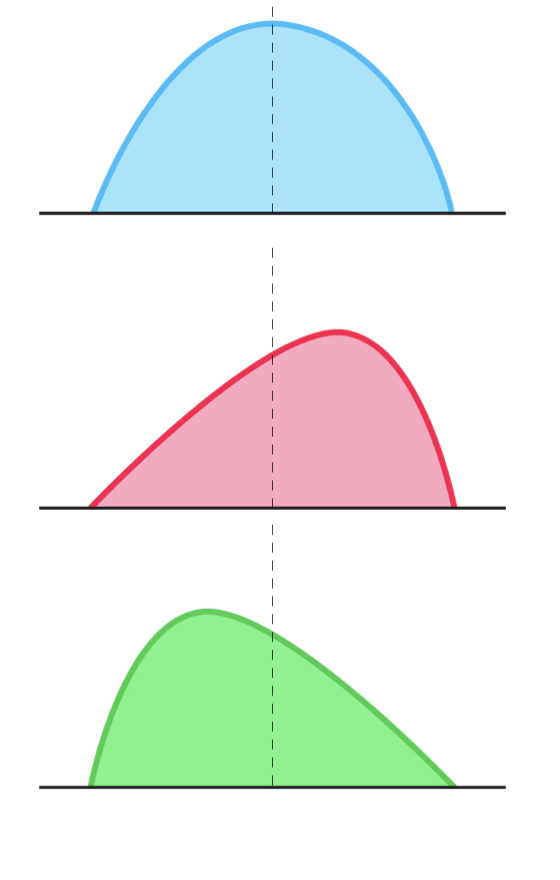
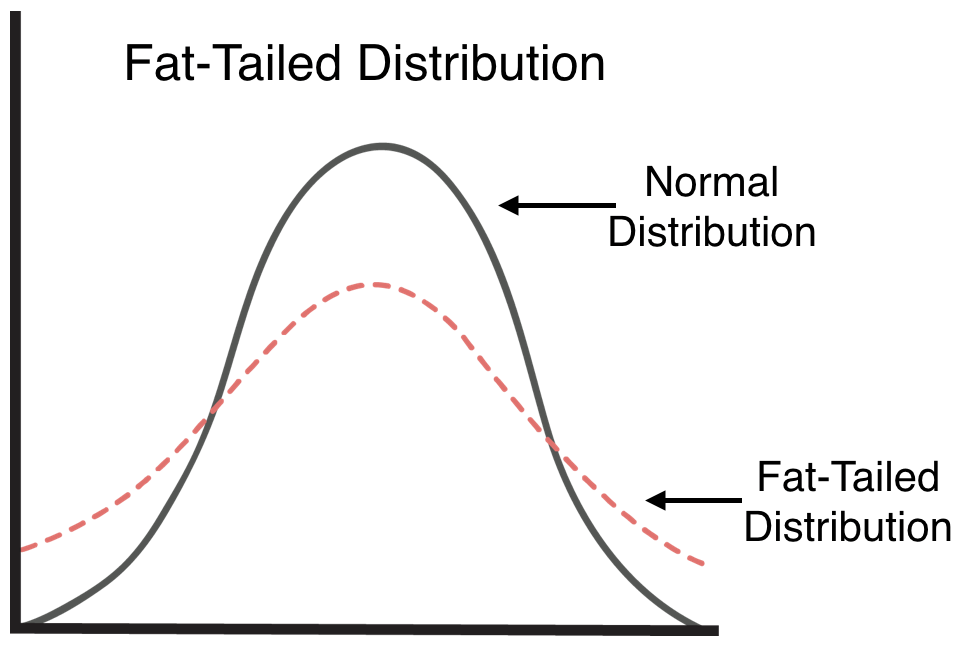
Kurtosis
- The distribution is fat-tailed when the excess kurtosis > 0