Time-variation in portfolio performance
Introduction to Portfolio Analysis in R

Kris Boudt
Professor, Free University Brussels & Amsterdam
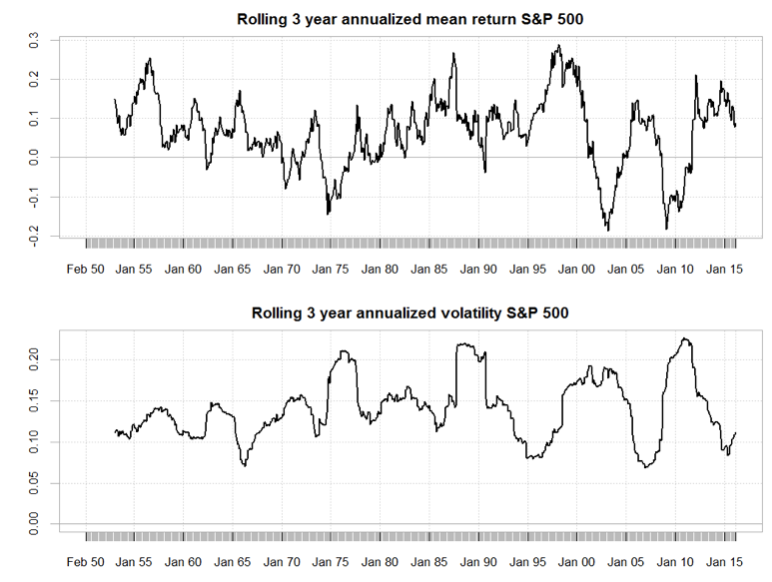
Bulls & bears
- Business cycle, news, and swings in the market psychology affect the market

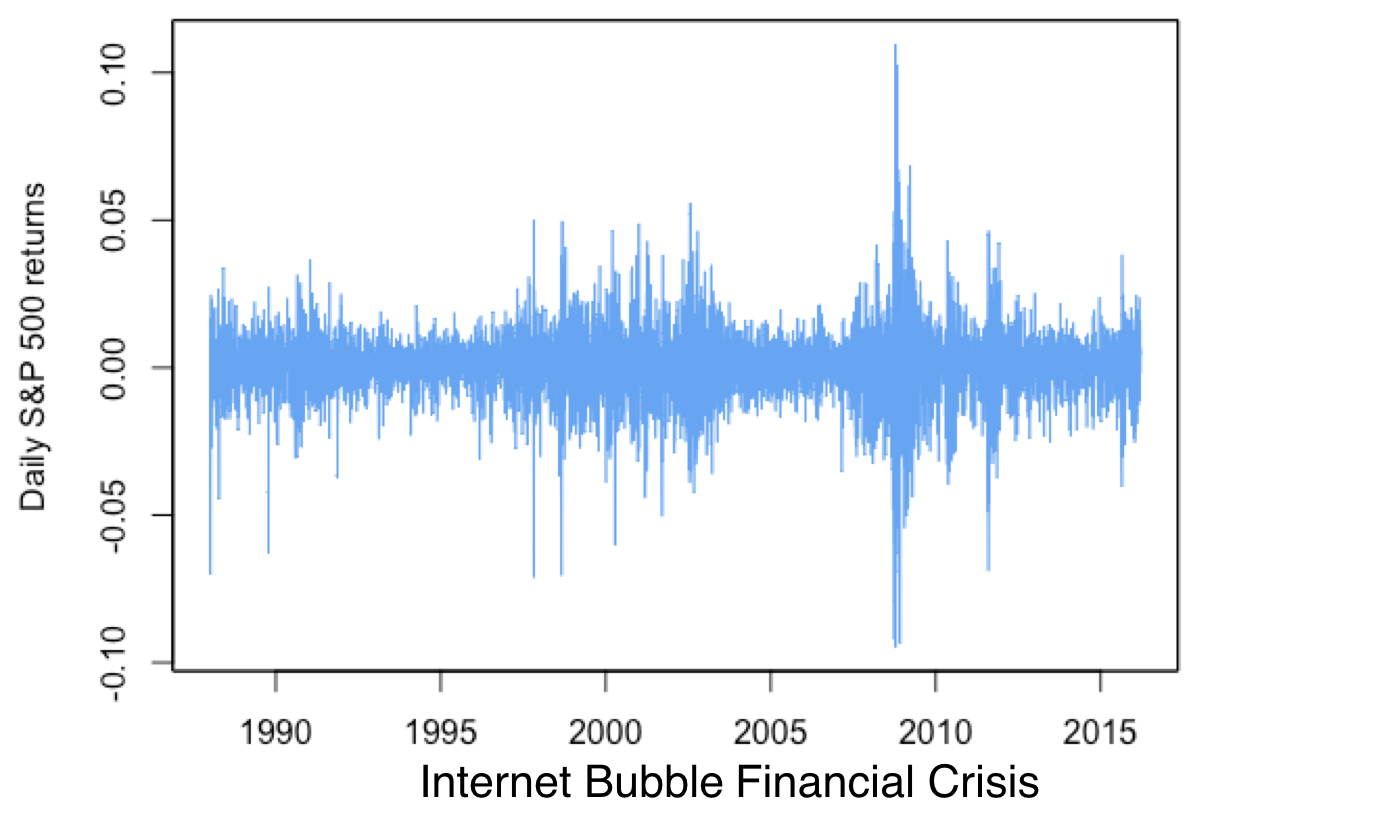
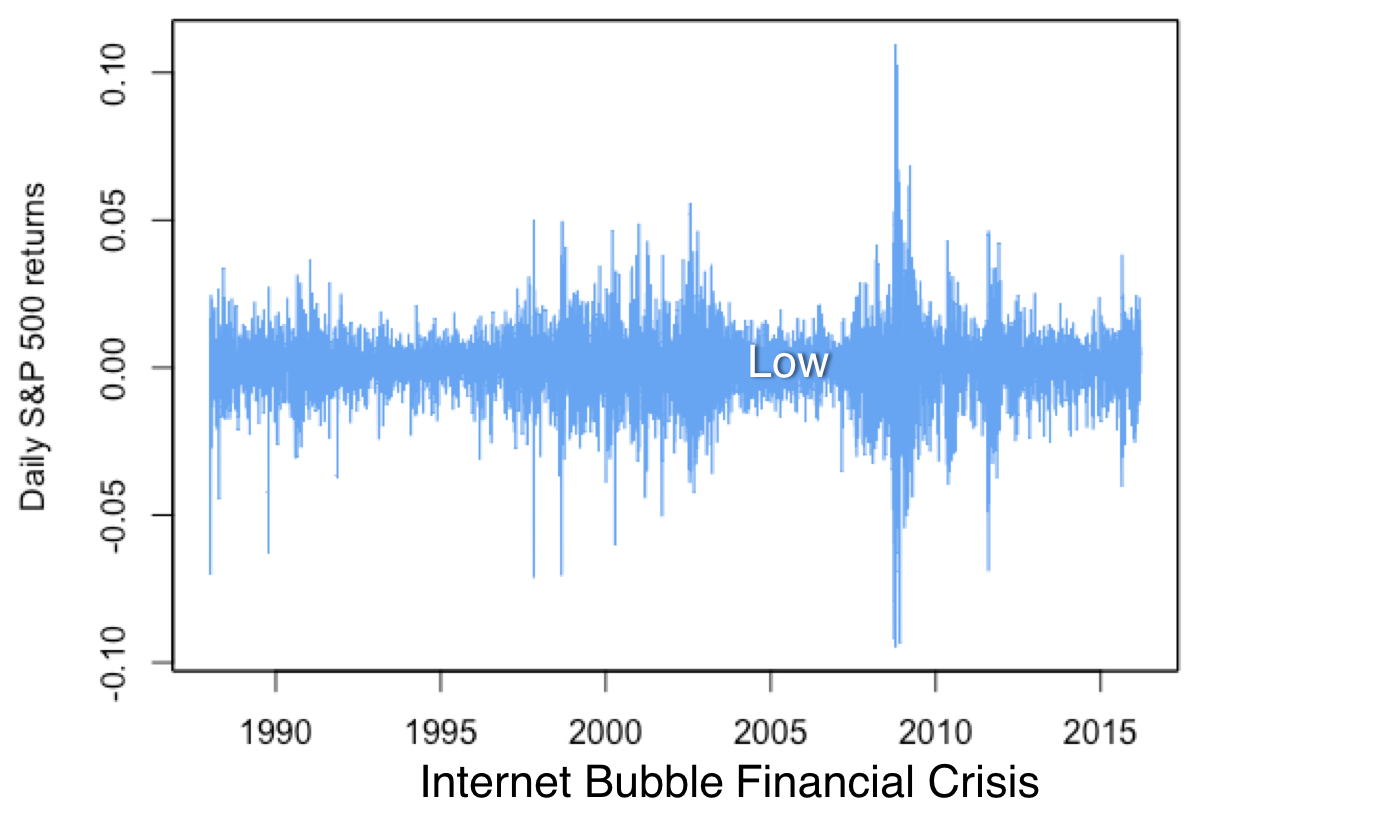
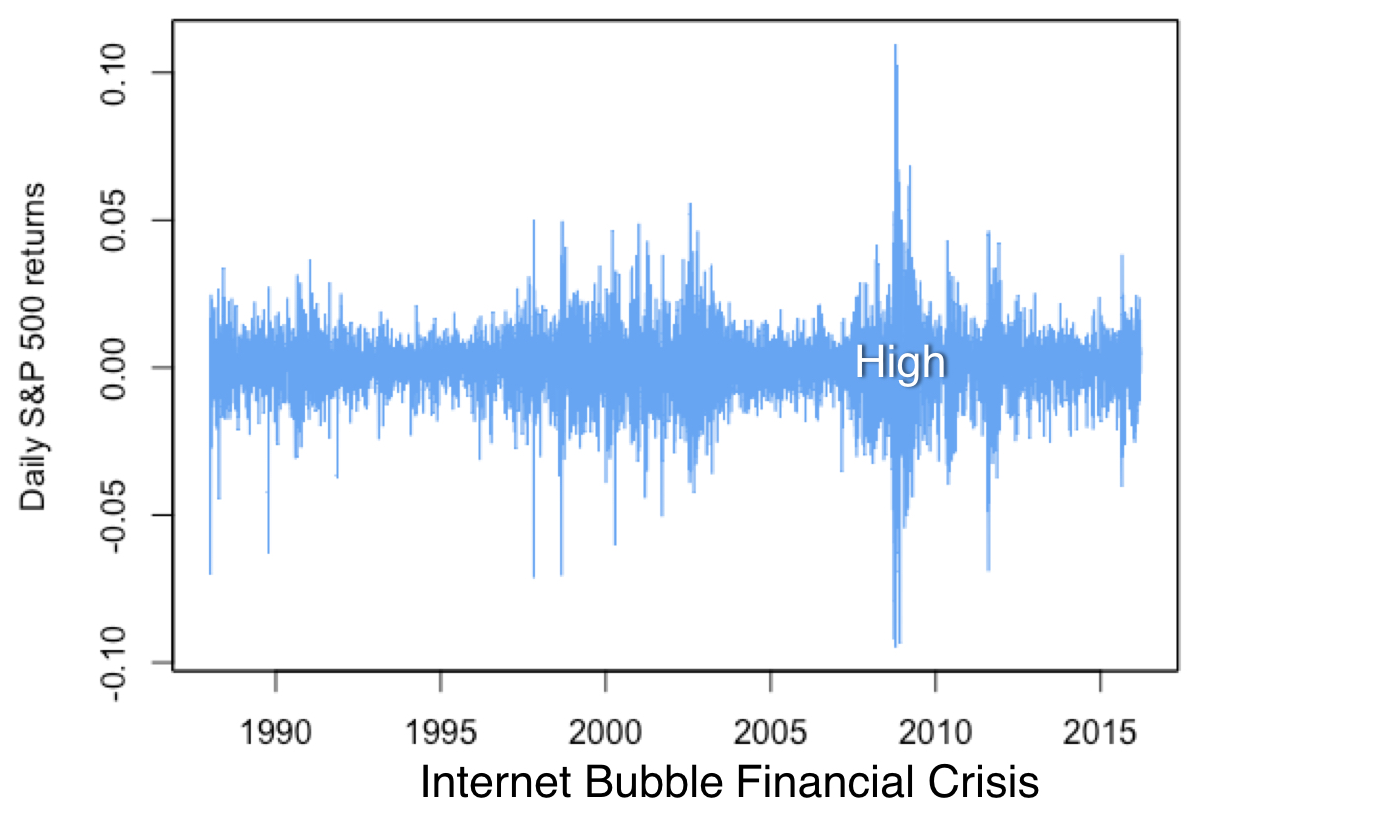
Clusters of high & low volatility
Performance statistics in action

Performance statistics in action

Performance statistics in action

Performance statistics in action

Performance statistics in action
Performance statistics in action

Performance statistics in action
Performance statistics in action

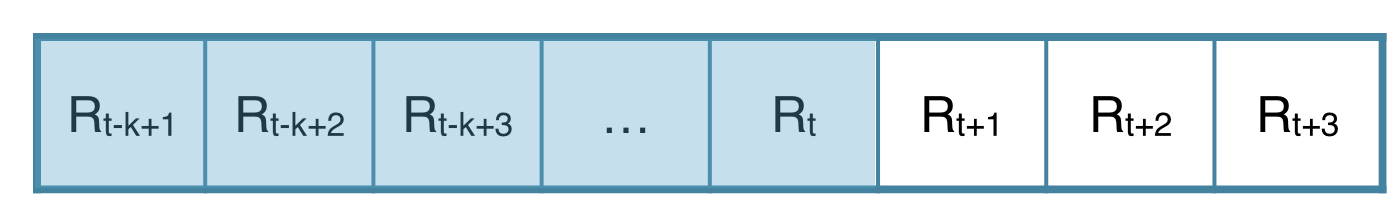
Rolling estimation samples
- Rolling samples of K observations:
- Discard the most distant and include the most recent

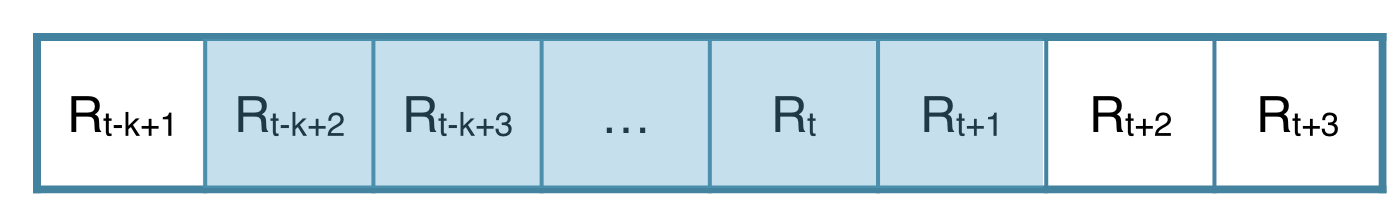
Rolling estimation samples
- Rolling samples of K observations:
- Discard the most distant and include the most recent
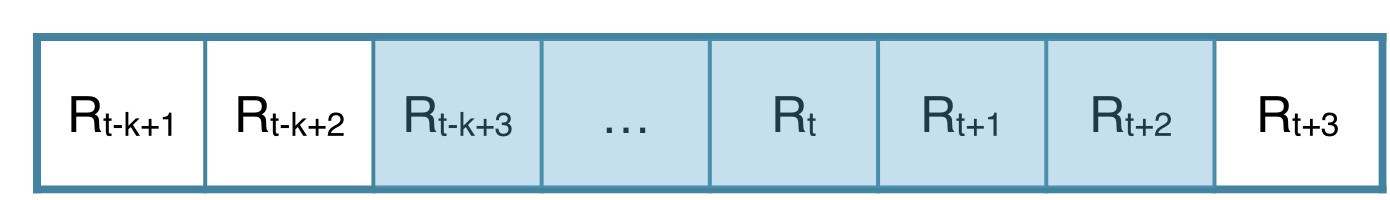
Rolling estimation samples
- Rolling samples of K observations:
- Discard the most distant and include the most recent

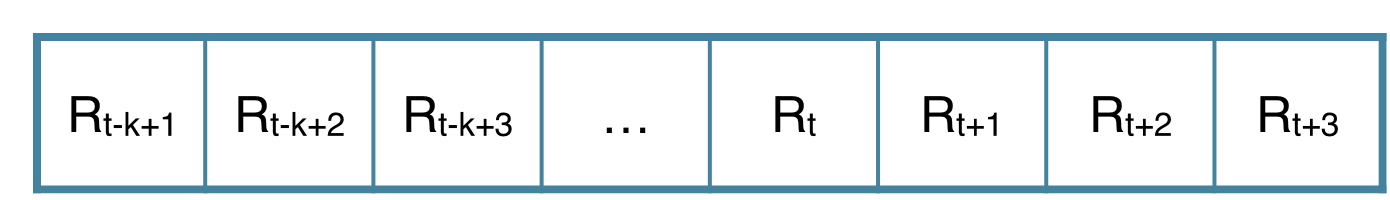
Rolling estimation samples
- Rolling samples of K observations:
- Discard the most distant and include the most recent
Rolling estimation samples
- Rolling samples of K observations:
- Discard the most distant and include the most recent

Rolling estimation samples
- Rolling samples of K observations:
- Discard the most distant and include the most recent
Rolling estimation samples
- Rolling samples of K observations:
- Discard the most distant and include the most recent
Rolling performance calculation