Making a histogram
Introduction to Data Science in Python

Hillary Green-Lerman
Lead Data Scientist, Looker
Tracking down the kidnapper

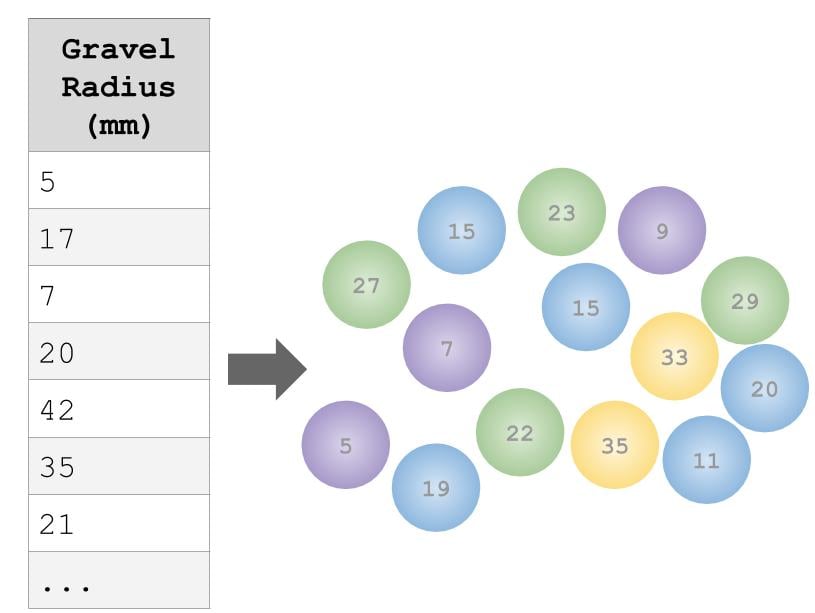
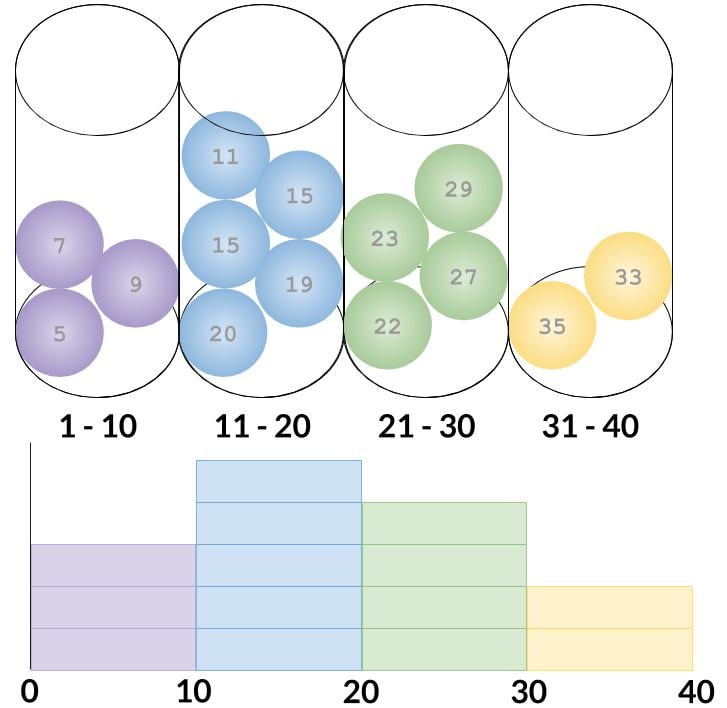
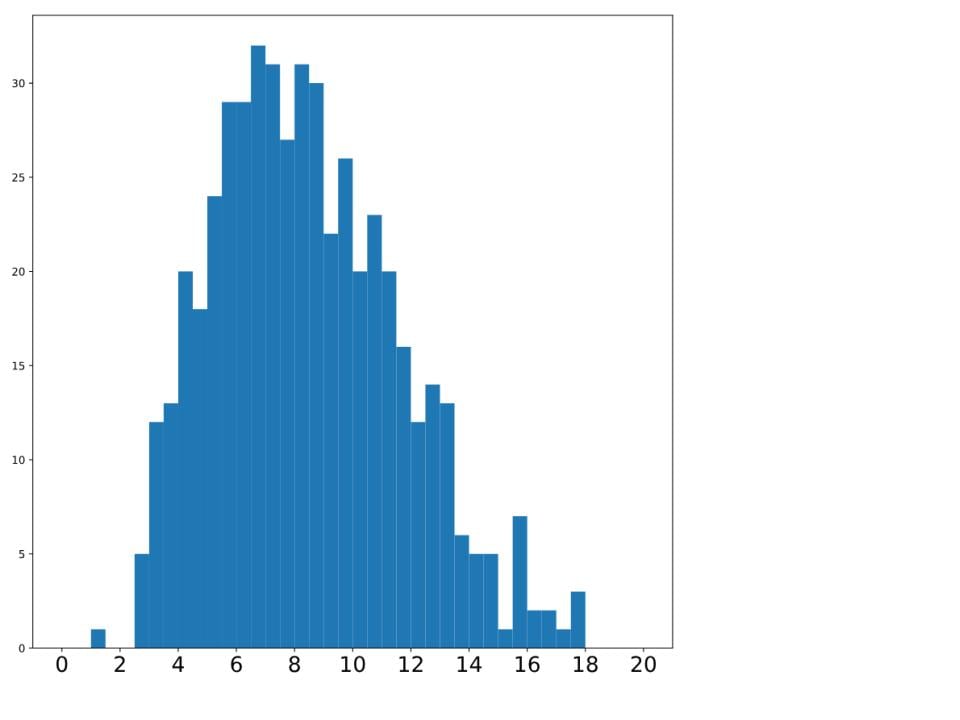
What is a histogram?
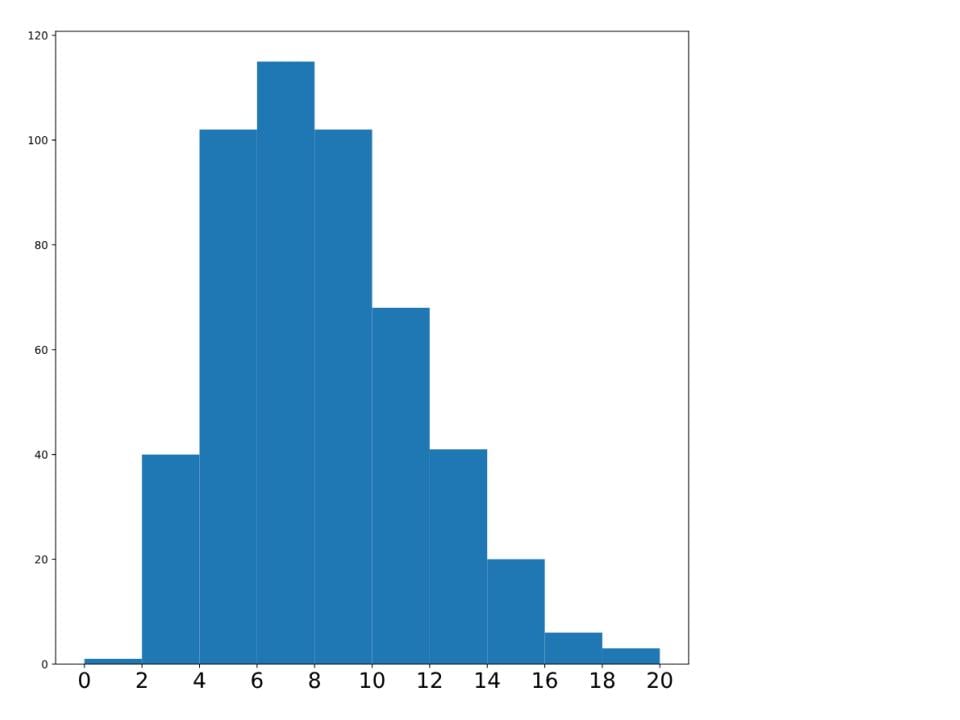
Histograms with matplotlib
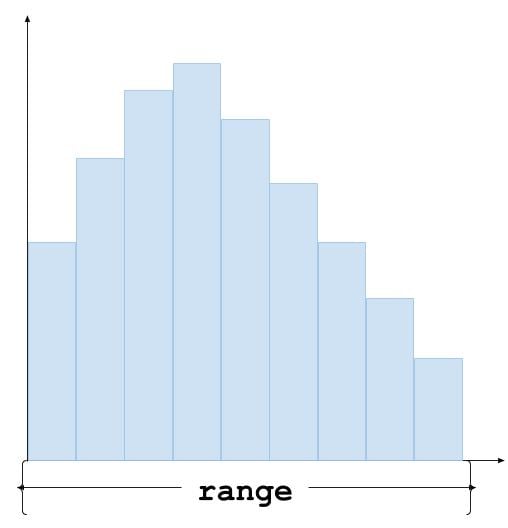
Changing bins
Changing range
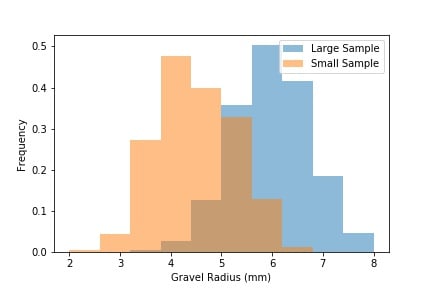
Normalizing
Unnormalized bar plot
plt.hist(male_weight)
plt.hist(female_weight)
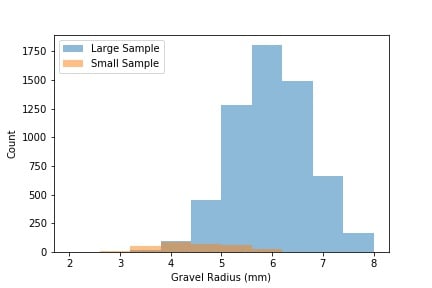
Sum of bar area = 1
plt.hist(male_weight, density=True)
plt.hist(female_weight, density=True)