Evaluating campaigns with pie & scatter charts
Marketing Analytics in Google Sheets
Luke Pajer
Digital Marketing Specialist
Campaigns data set
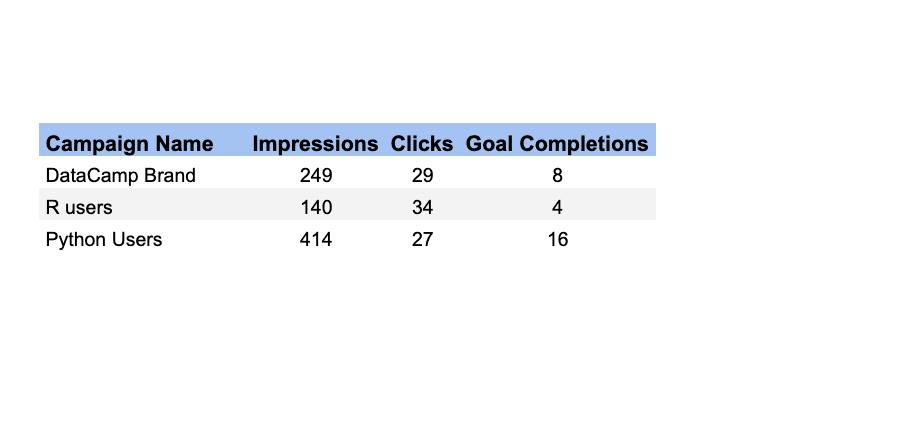
Campaigns data set
- Goal completions
- Measured interactions on websites
- Examples of goal completions:
- Submitting an online form
- Purchasing a subscription
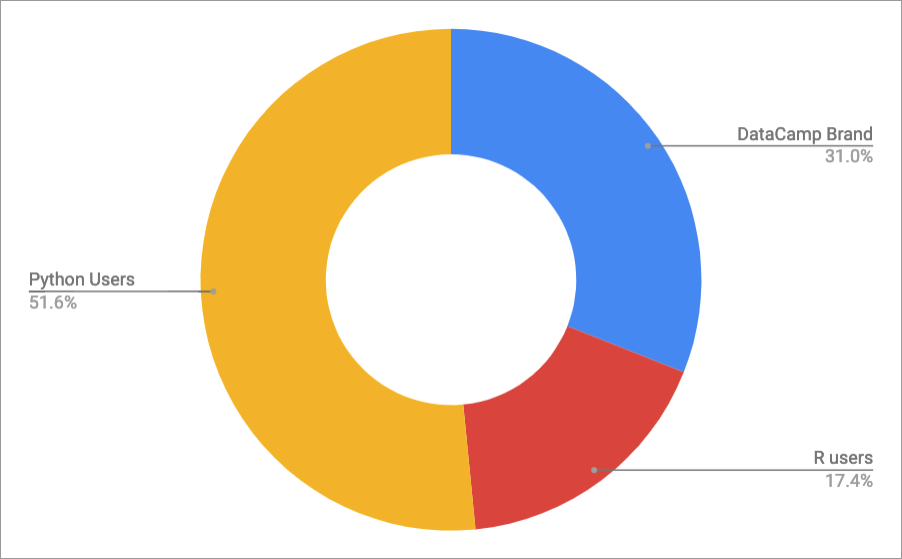
Campaign impression share
- Pie chart

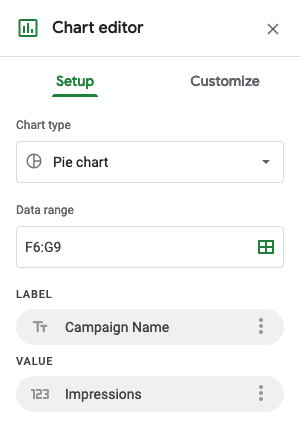
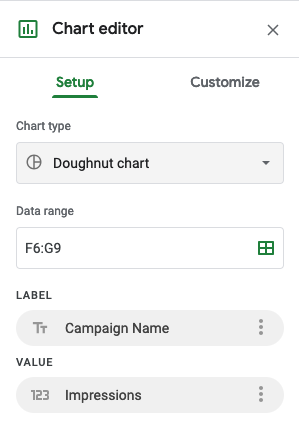
Transform a pie chart into a doughnut chart
- Doughnut chart = pie chart, but with a hole in the middle
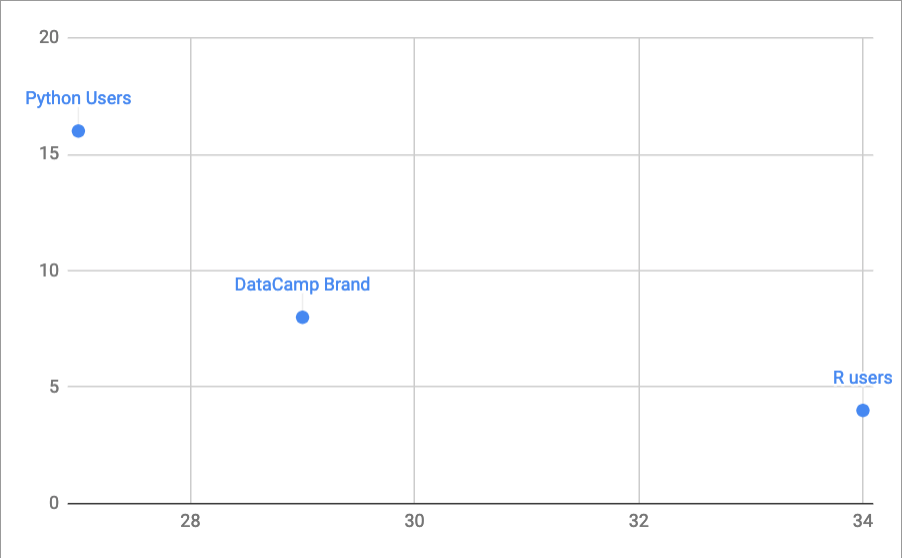
Determining relationship between goal completions and clicks
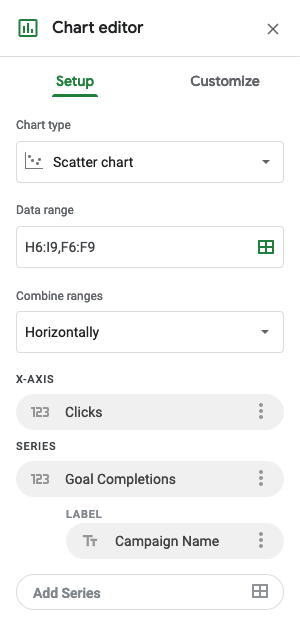
- Scatter chart
Adding weight to a scatter chart
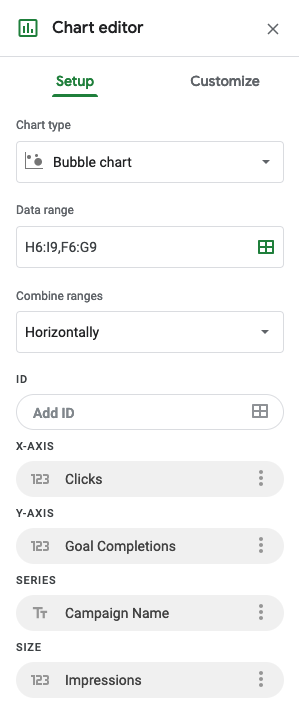
- Bubble chart = scatter chart with weight applied to each measurement

Let's recap
- Goal completions
- Important user engagements that measure the effectiveness of a campaign
- Pie/doughnut charts
- Display relative makeup of a total
- Scatter charts
- Great for determining the relative relationship between two metrics
- Bubble charts
- Makes the chart more informative by adding another dimension (size)
Let's get to work!
Marketing Analytics in Google Sheets

