What is time series data?

Manipulating Time Series Data in R

Harrison Brown

Graduate Researcher in Geography

What is a time series?

  • A time series is a collection of data points ordered sequentially over time.

Slide one of three, depicting examples of plots of time series data. This graph plots the date on the x-axis and the monthly number of airline passengers on the y-axis.

Manipulating Time Series Data in R

What is a time series?

  • A time series is a collection of data points ordered sequentially over time.

Slide two of three, depicting examples of plots of time series data. This graph plots the date on the x-axis and the closing price of the Financial Times Stock Exchange on the y-axis.

Manipulating Time Series Data in R

What is a time series?

  • A time series is a collection of data points ordered sequentially over time.

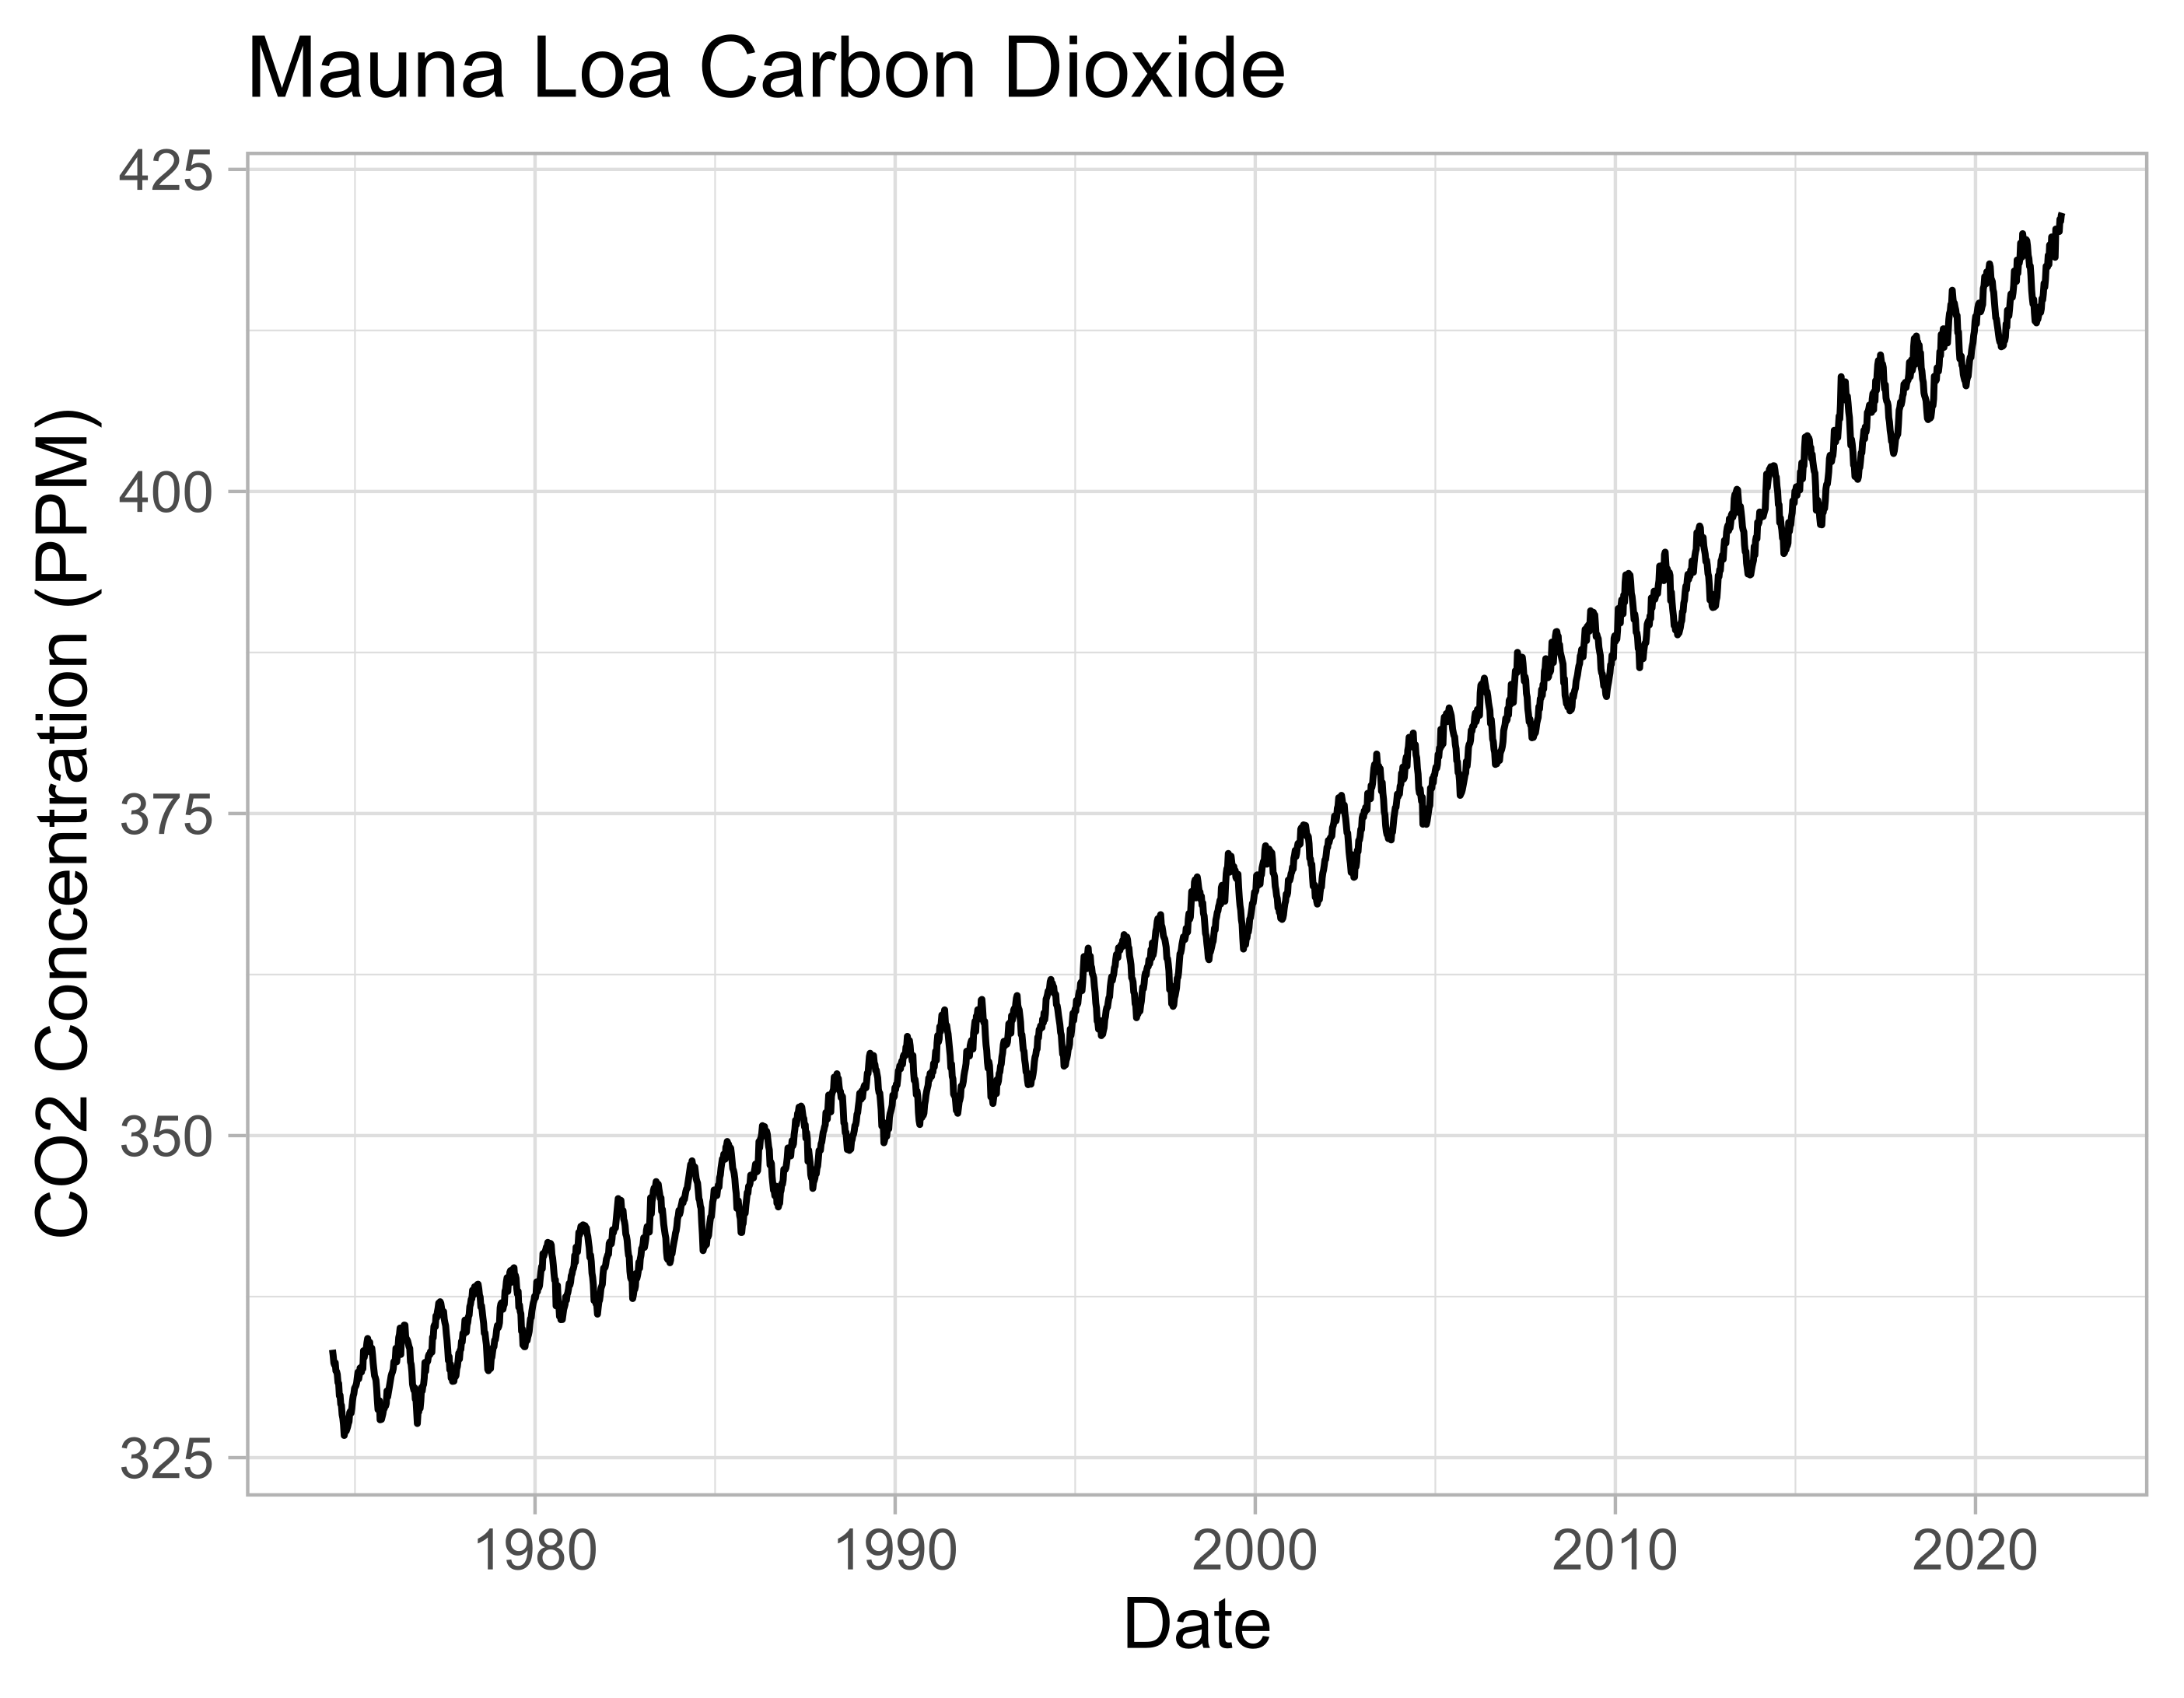
Slide three of three depicting examples of plots of time series data. This graph plots the date on the x-axis and the concentration of atmospheric carbon dioxide, measured at the Mauna Loa observatory in Hawaii, on the y-axis.

Manipulating Time Series Data in R

Time series in R

  • In R, time series datasets are usually ts or zoo objects.
AirPassengers
     Jan Feb Mar Apr May Jun Jul Aug ...
1949 112 118 132 129 121 135 148 148 ...
1950 115 126 141 135 125 149 170 170 ...
1951 145 150 178 163 172 178 199 199 ...
1952 171 180 193 181 183 218 230 242 ...
1953 196 196 236 235 229 243 264 272 ...
...
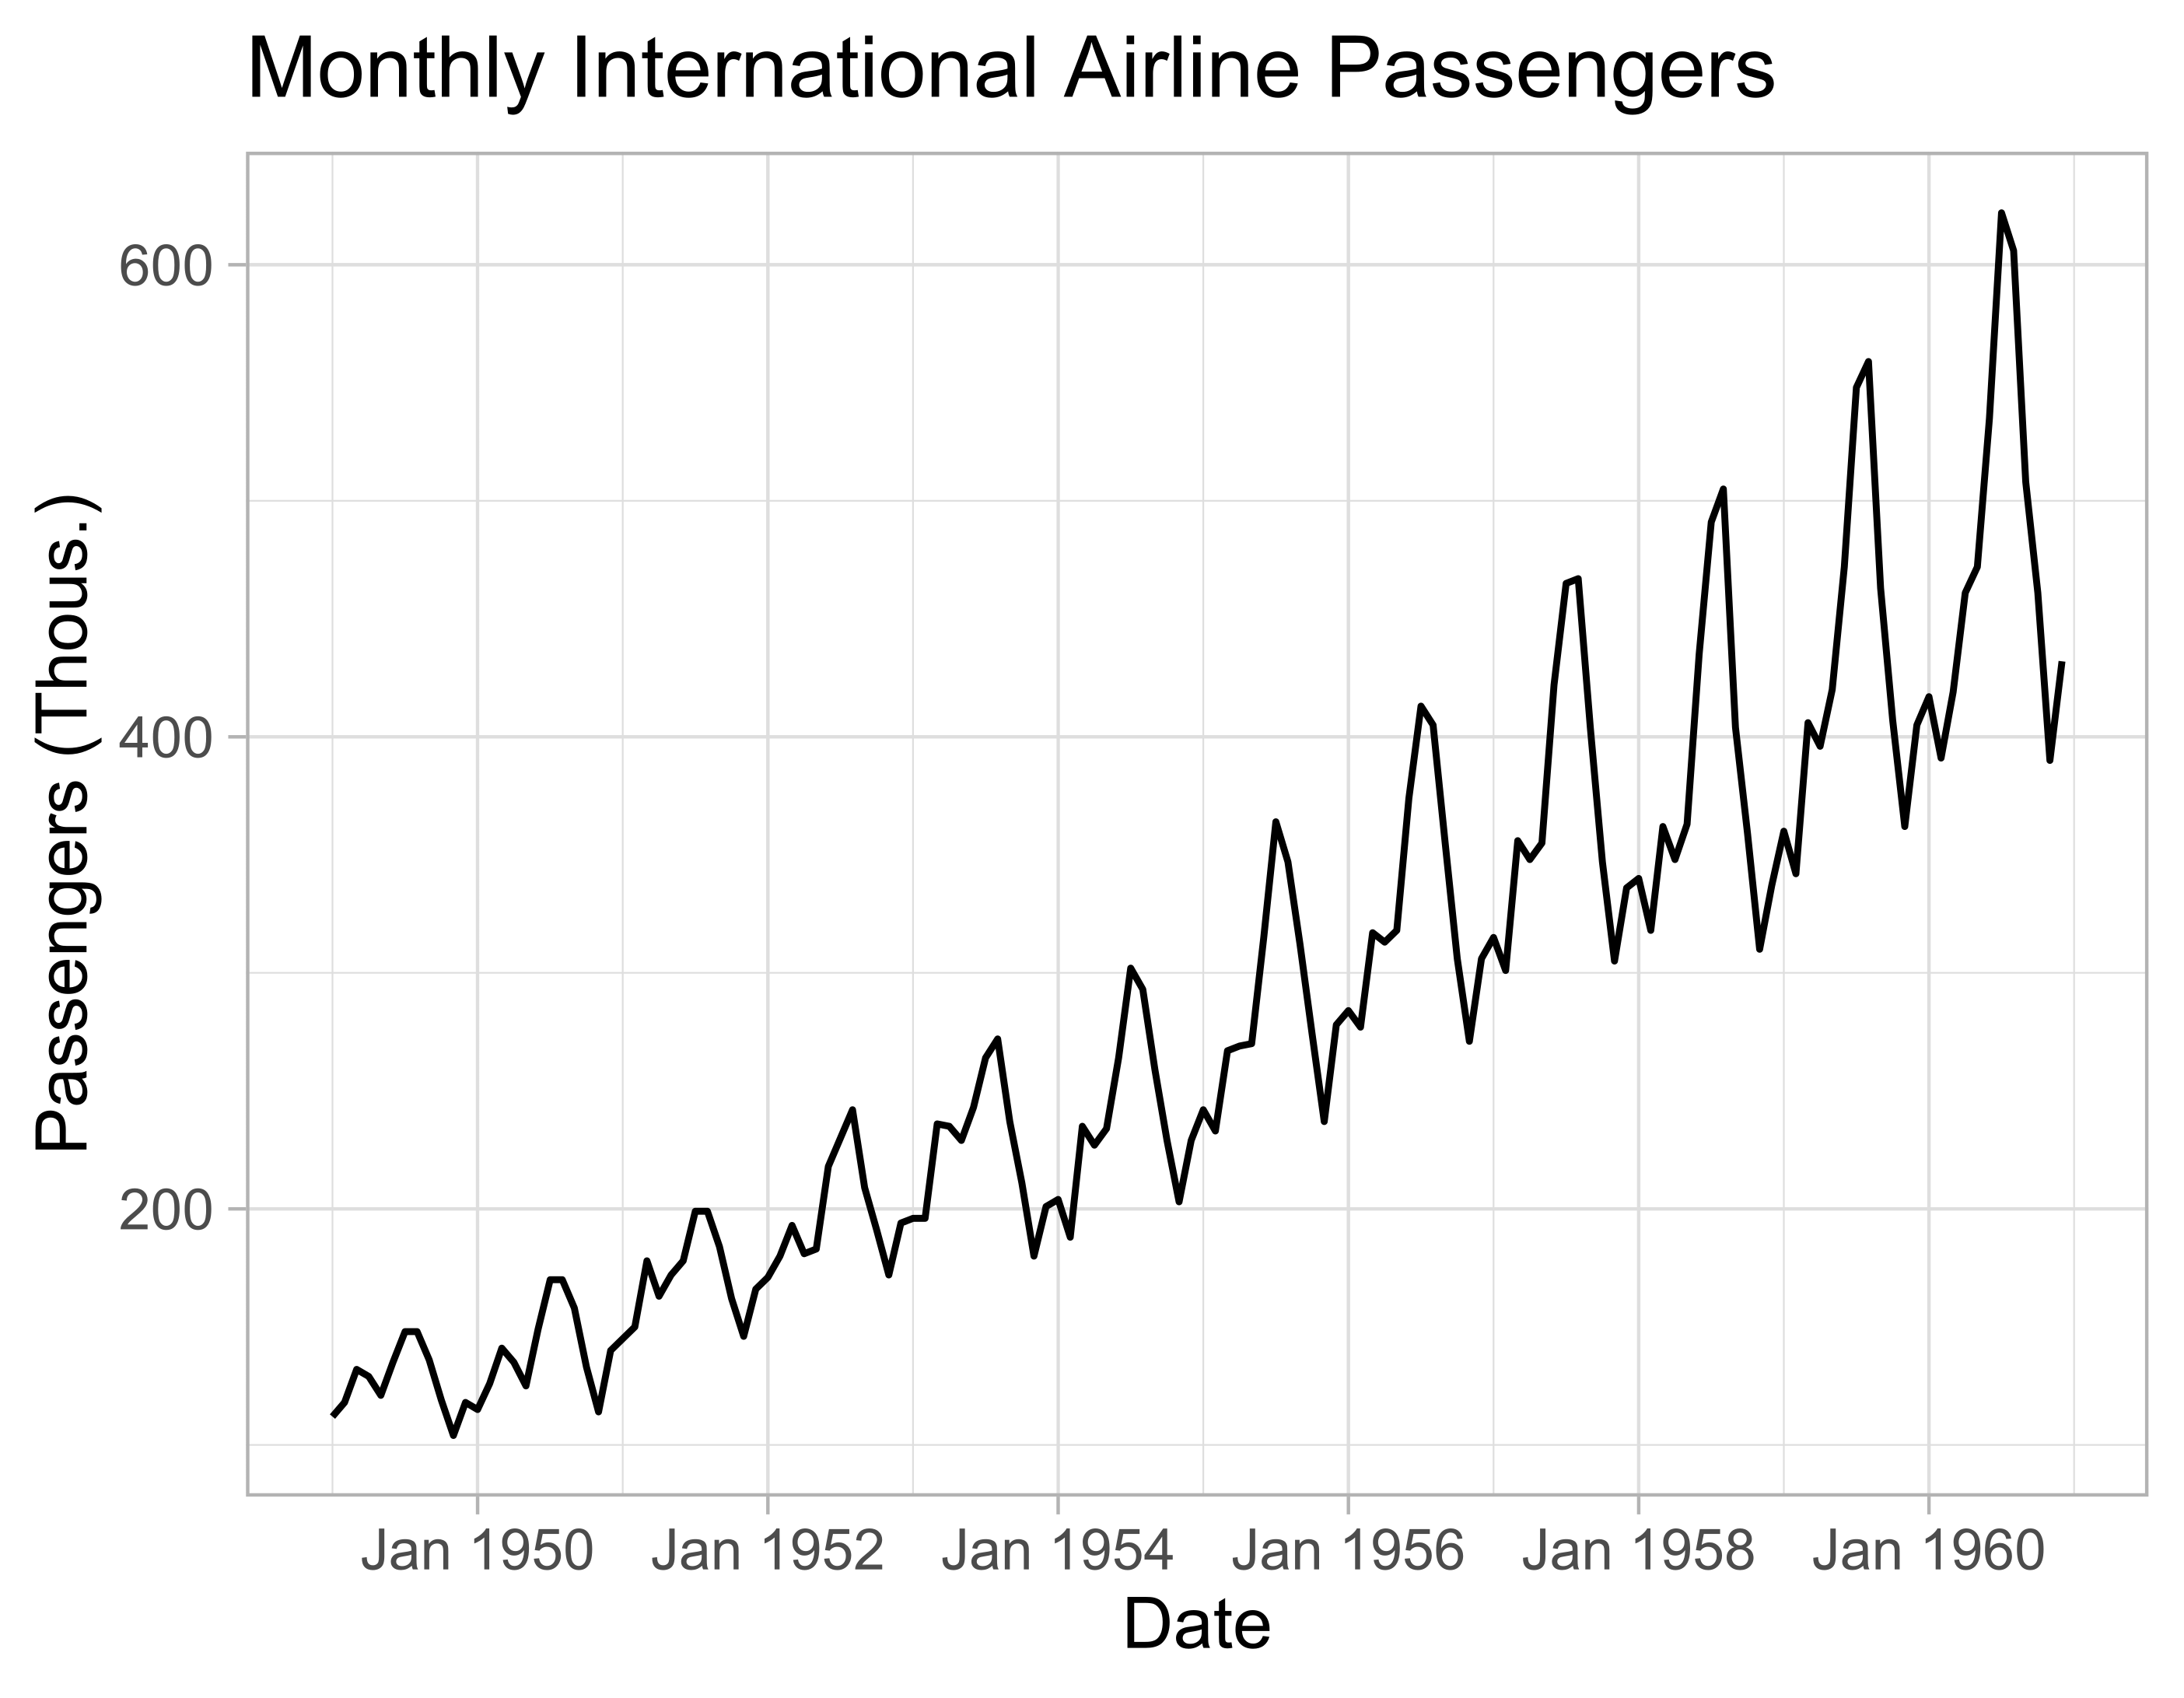
A plot of the AirPassengers dataset. The x-axis depicts the date, from January 1949 to December 1960, and the y-axis measures the monthly number of passengers, in thousands. The values of the plot show a highly "seasonal" pattern; a peak and lull in the number of passengers occurs at approximately the same time each year. The observations follow a generally-upwards trend, with values increasing with time.

Manipulating Time Series Data in R

Summary statistics

AirPassengers
     Jan Feb Mar Apr May Jun Jul Aug ...
1949 112 118 132 129 121 135 148 148 ...
1950 115 126 141 135 125 149 170 170 ...
1951 145 150 178 163 172 178 199 199 ...
1952 171 180 193 181 183 218 230 242 ...
1953 196 196 236 235 229 243 264 272 ...
...
base::summary(AirPassengers)
Min.    104
1st Qu. 180
Median  265.5
Mean    280.2986
3rd Qu. 360.5
Max.    622
Manipulating Time Series Data in R

Why use time series objects in R?

Time series objects:

  • work better with specialized tools,
  • keep track of date and time,
  • aid in smoother workflows!
Manipulating Time Series Data in R

Plotting with autoplot

autoplot(maunaloa)
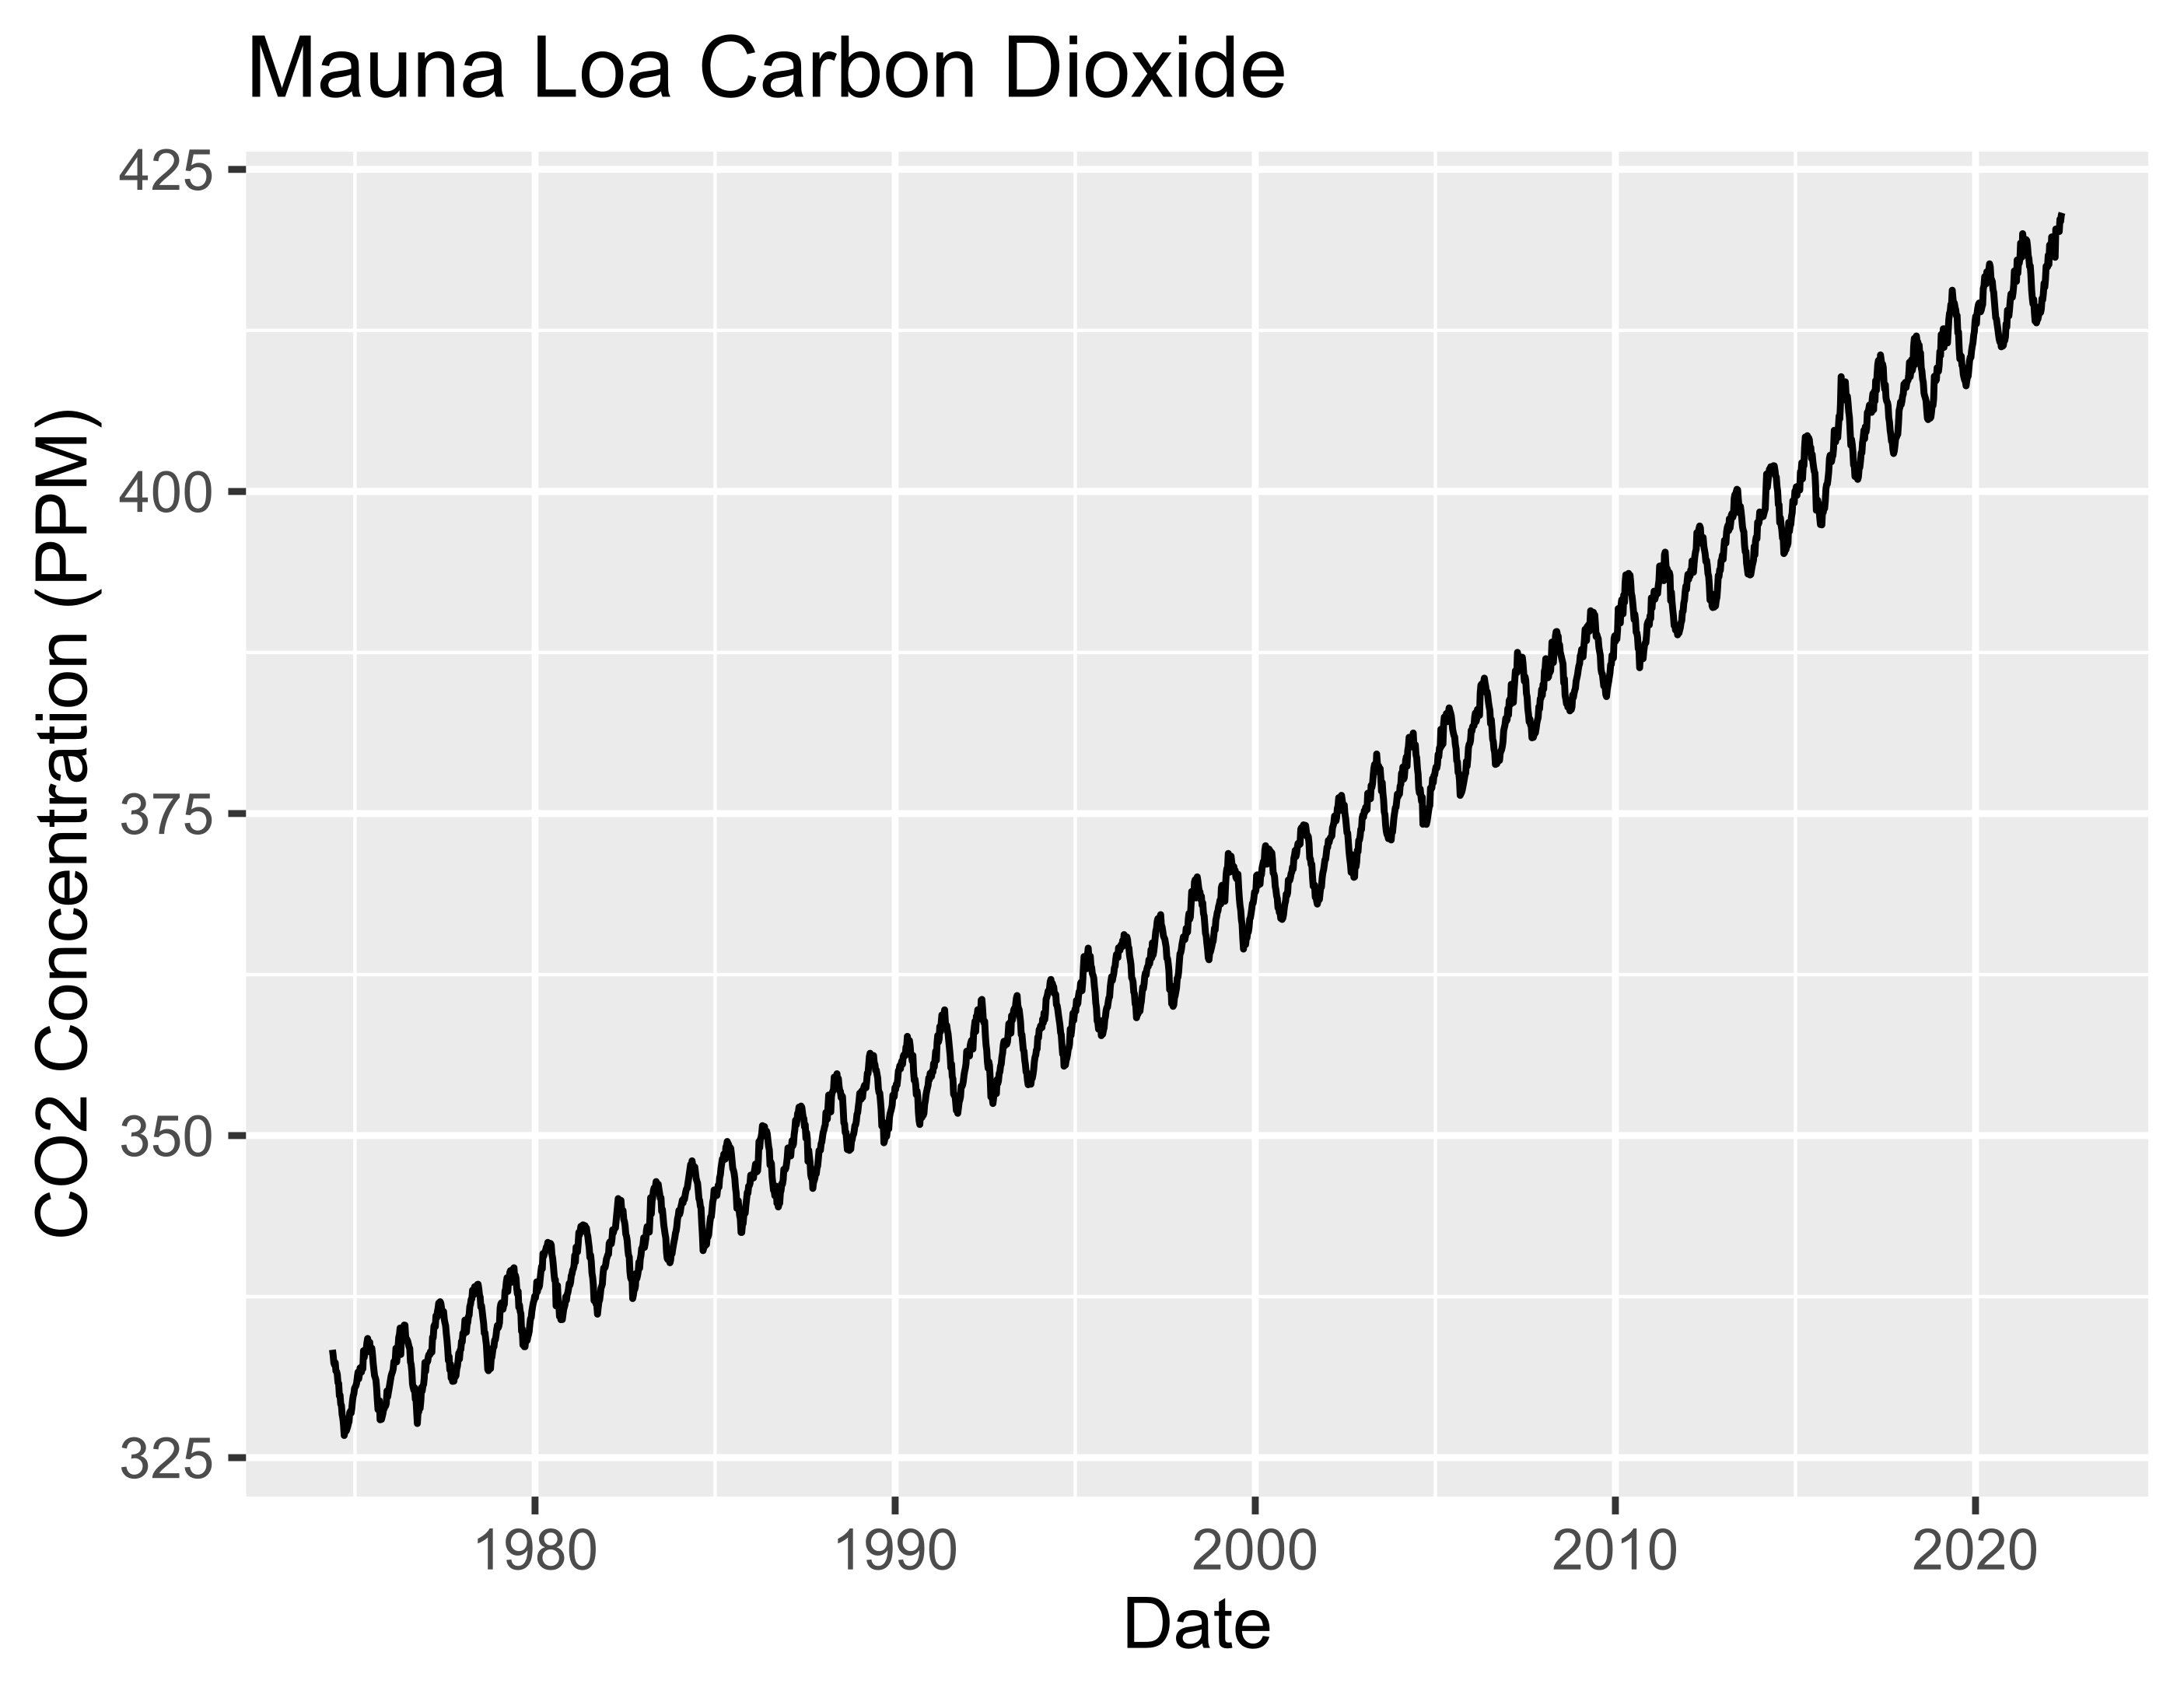
A plot of the Mauna Loa dataset. This plot was generated with the ggplot2 R package, and uses the default color theme.

autoplot(maunaloa) + 
  theme_light()

A plot of the Mauna Loa dataset, generated by ggplot2. This plot uses the "light" theme.

Manipulating Time Series Data in R

Let's practice!

Manipulating Time Series Data in R

Preparing Video For Download...