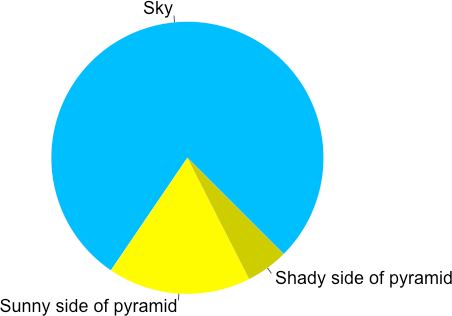
Polar coordinates
Understanding Data Visualization

Richie Cotton
Data Evangelist at DataCamp
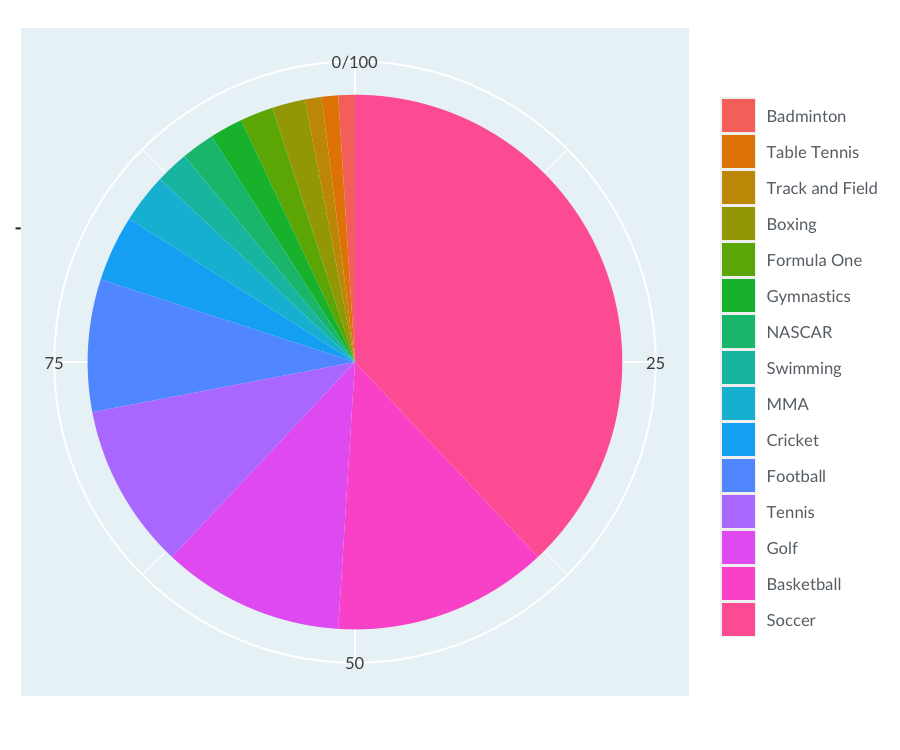
Pie plots
ESPN famous athletes, by sport
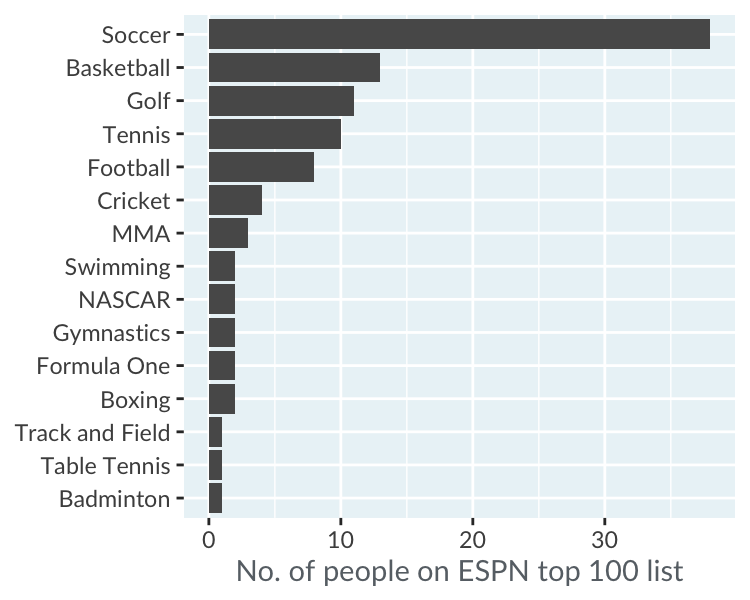
Bar plot + polar coords = pie plot
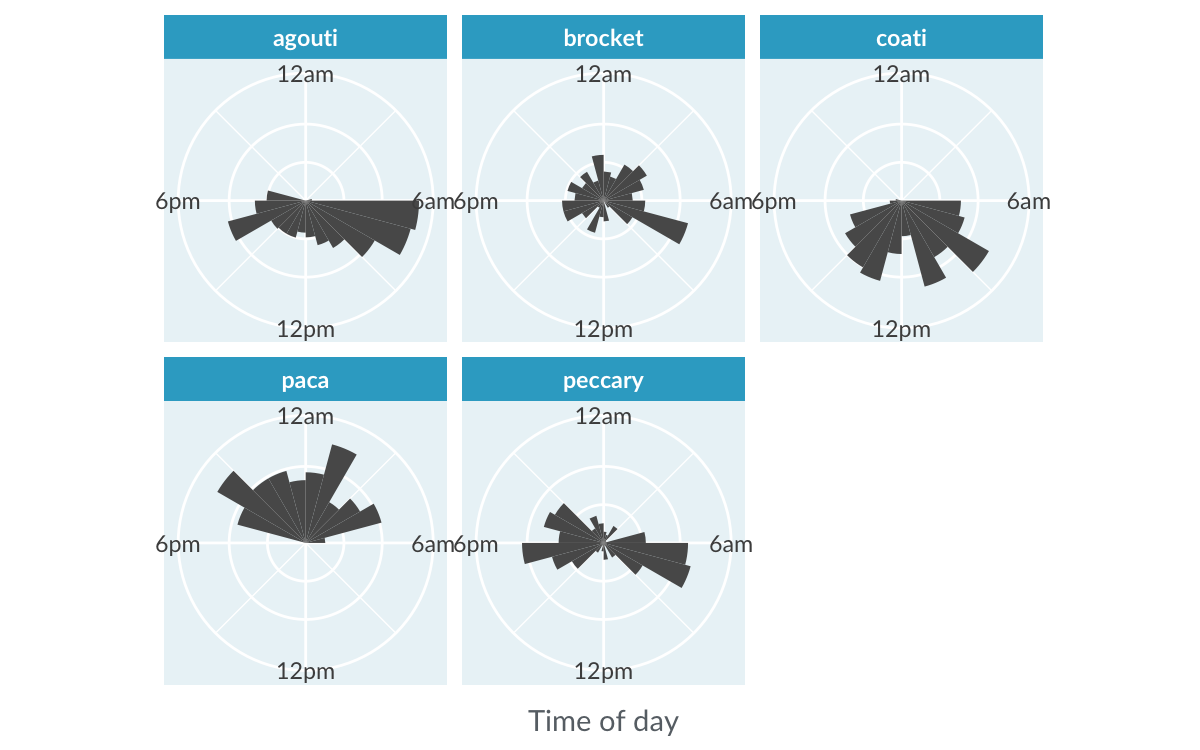
Histogram of animal activity
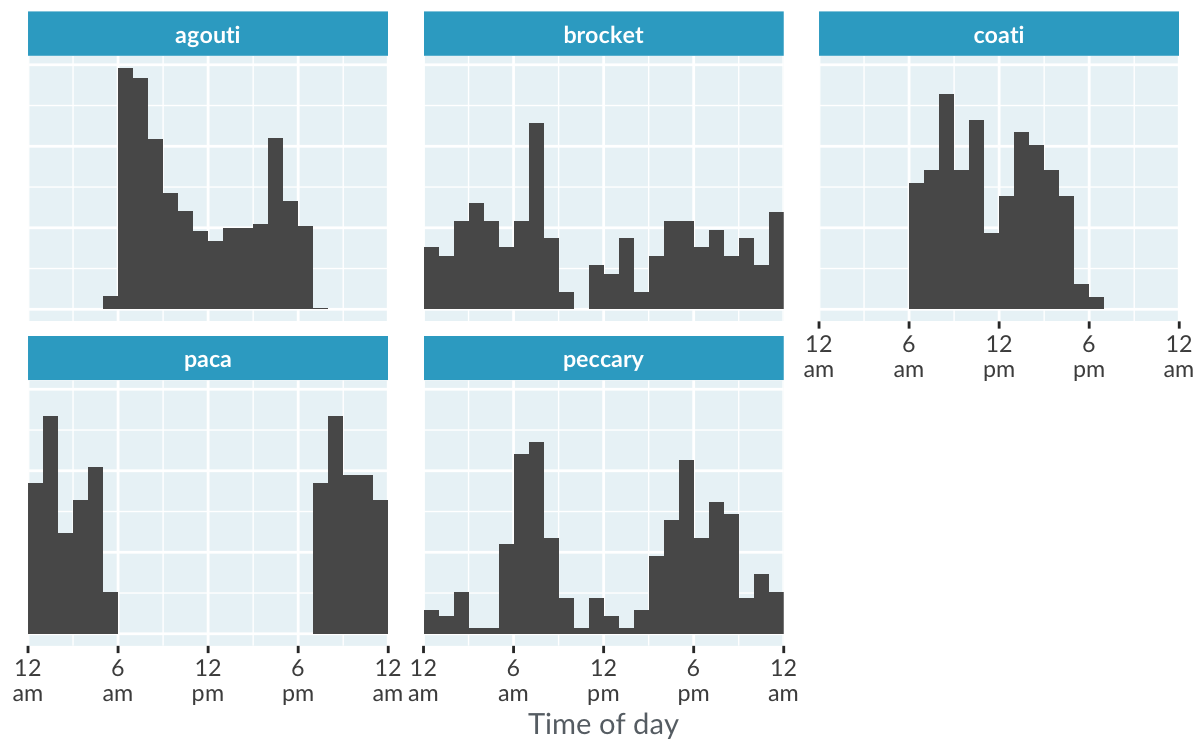
Histogram + polar coords = rose plot
Understanding Data Visualization
Richie Cotton
Data Evangelist at DataCamp

