Computing with Multidimensional Arrays
Parallel Computing with Dask

Dhavide Aruliah
Director of Training, Anaconda
A Numpy array of time series data
import numpy as np time_series = np.loadtxt('max_temps.csv', dtype=np.int64)print(time_series.dtype)
int64
print(time_series.shape)
(21,)
print(time_series.ndim)
1
Reshaping time series data
print(time_series)
[49 51 60 54 47 50 64 58 47 43 50 63 67 68 64 48 55 46 66 51 52]
table = time_series.reshape((3,7)) # Reshaped row-wise
print(table) # Display the result
[[49 51 60 54 47 50 64]
 [58 47 43 50 63 67 68]
 [64 48 55 46 66 51 52]]
Reshaping: Getting the order correct!
print(time_series)
[49 51 60 54 47 ... 46 66 51 52]
 # Incorrect!
time_series.reshape((7,3))
array([[49, 51, 60],
       [54, 47, 50],
       [64, 58, 47],
       [43, 50, 63],
       [67, 68, 64],
       [48, 55, 46],
       [66, 51, 52]])
# Column-wise: correct
time_series.reshape((7,3),
    order='F')
array([[49, 58, 64],
       [51, 47, 48],
       [60, 43, 55],
       [54, 50, 46],
       [47, 63, 66],
       [50, 67, 51],
       [64, 68, 52]])
Using reshape: Row- & column-major ordering
- Row-major ordering (outermost index changes fastest)
order='C'(consistent with C; default)
- Column-major ordering (innermost index changes fastest)
order='F'(consistent with FORTRAN)
Indexing in multiple dimensions
print(table) # Display the result
[[49 51 60 54 47 50 64]
 [58 47 43 50 63 67 68]
 [64 48 55 46 66 51 52]]
table[0, 4] # value from Week 0, Day 4
47
table[1, 2:5] # values from Week 1, Days 2, 3, & 4
array([43, 50, 63])
Indexing in multiple dimensions
table[0::2, ::3] # values from Weeks 0 & 2, Days 0, 3, & 6
array([[49, 54, 64],
       [64, 46, 52]])
table[0] # Equivalent to table[0, :]
array([49, 51, 60, 54, 47, 50, 64])
Aggregating multidimensional arrays
print(table)
[[49 51 60 54 47 50 64]
 [58 47 43 50 63 67 68]
 [64 48 55 46 66 51 52]]
table.mean() # mean of *every* entry in table
54.904761904761905
# Averages for days
daily_means = table.mean(axis=0)
Aggregating multidimensional arrays
daily_means # Mean computed of rows (for each day)
array([ 57.        ,  48.66666667,  52.66666667,  50.        ,
        58.66666667,  56.        ,  61.33333333])
weekly_means = table.mean(axis=1)
weekly_means # mean computed of columns (for each week)
array([ 53.57142857, 56.57142857, 54.57142857])
table.mean(axis=(0,1)) # mean of rows, then columns
54.904761904761905
table - daily_means # This works!
array([[ -8.        ,   2.33333333,   7.33333333,   4.        ,
          -11.66666667,  -6.        ,   2.66666667],
         [  1.        ,  -1.66666667,  -9.66666667,   0.        ,
            4.33333333,  11.        ,   6.66666667],
         [  7.        ,  -0.66666667,   2.33333333,  -4.        ,
            7.33333333,  -5.        ,  -9.33333333]])
table - weekly_means # This doesn't!
ValueError                       Traceback (most recent call last)
    ---> 1 table - weekly_means # This doesn't!

ValueError: operands could not be broadcast together with shapes
    (3,7) (3,)
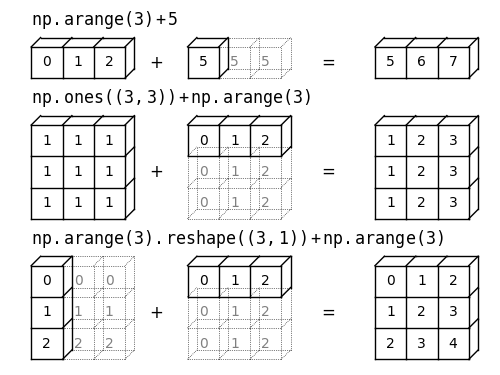
Broadcasting rules
- Compatible Arrays:
- same
ndim: all dimensions same or 1 - different
ndim: smaller shape prepended with ones & #1. applies
- same
- Broadcasting: copy array values to missing dimensions, then do arithmetic
print(table.shape)
(3, 7)
print(daily_means.shape)
(7,)
print(weekly_means.shape)
(3,)
# This works now!
result = table -
    weekly_means.reshape((3,1))
table - daily_means:(3,7) - (7,)$\rightarrow$(3,7) - (1,7): compatibletable - weekly_means:(3,7) - (3,)$\rightarrow$(3,7) - (1,3): incompatibletable - weekly_means.reshape((3,1)):(3,7) - (3,1): compatible
Connecting with Dask
data = np.loadtxt('', usecols=(1,2,3,4), dtype=np.int64)
data.shape
(366, 4)
type(data)
numpy.ndarray
data_dask = da.from_array(data, chunks=(366,2))
result = data_dask.std(axis=0) # Standard deviation down columns
result.compute()
array([ 15.08196053, 14.9456851 , 15.52548285, 14.47228351])
Let's practice!
Parallel Computing with Dask

