Multivariate skew distributions
Multivariate Probability Distributions in R

Surajit Ray
Professor, University of Glasgow
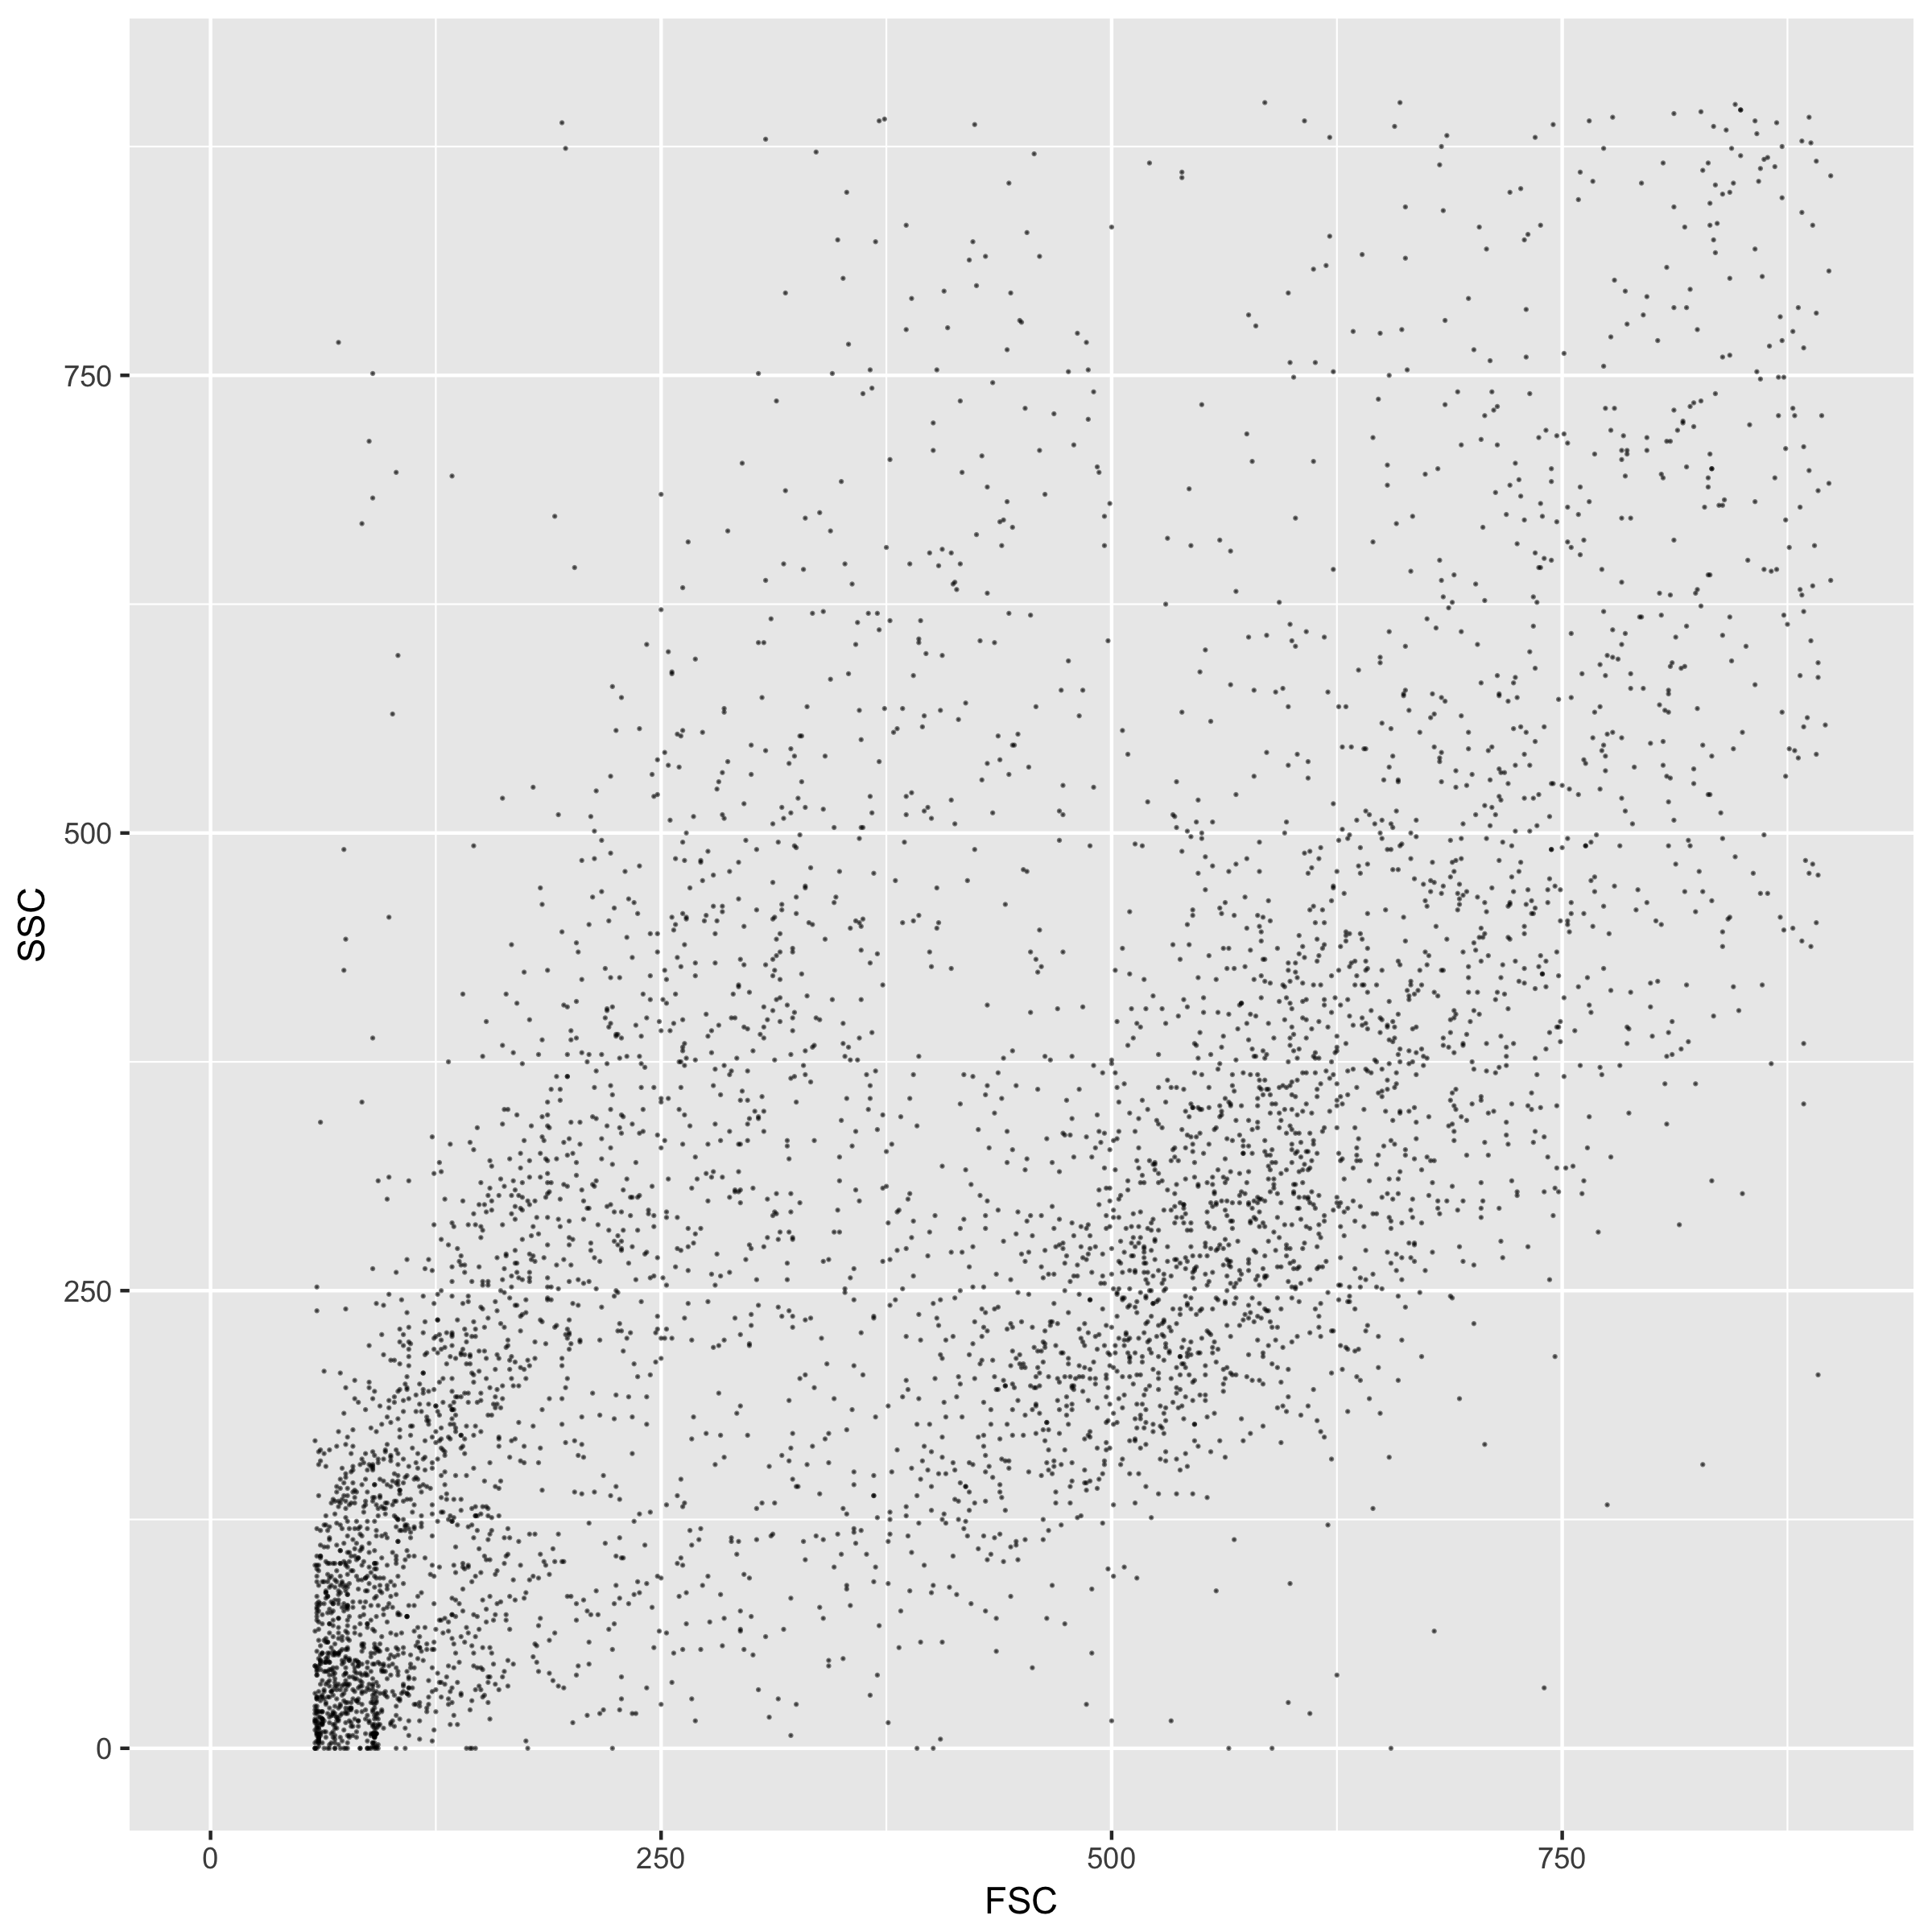
Skew multivariate distribution: scatterplot
Flow cytometry data -- side scatter (SSC) and forward scatter (FSC)
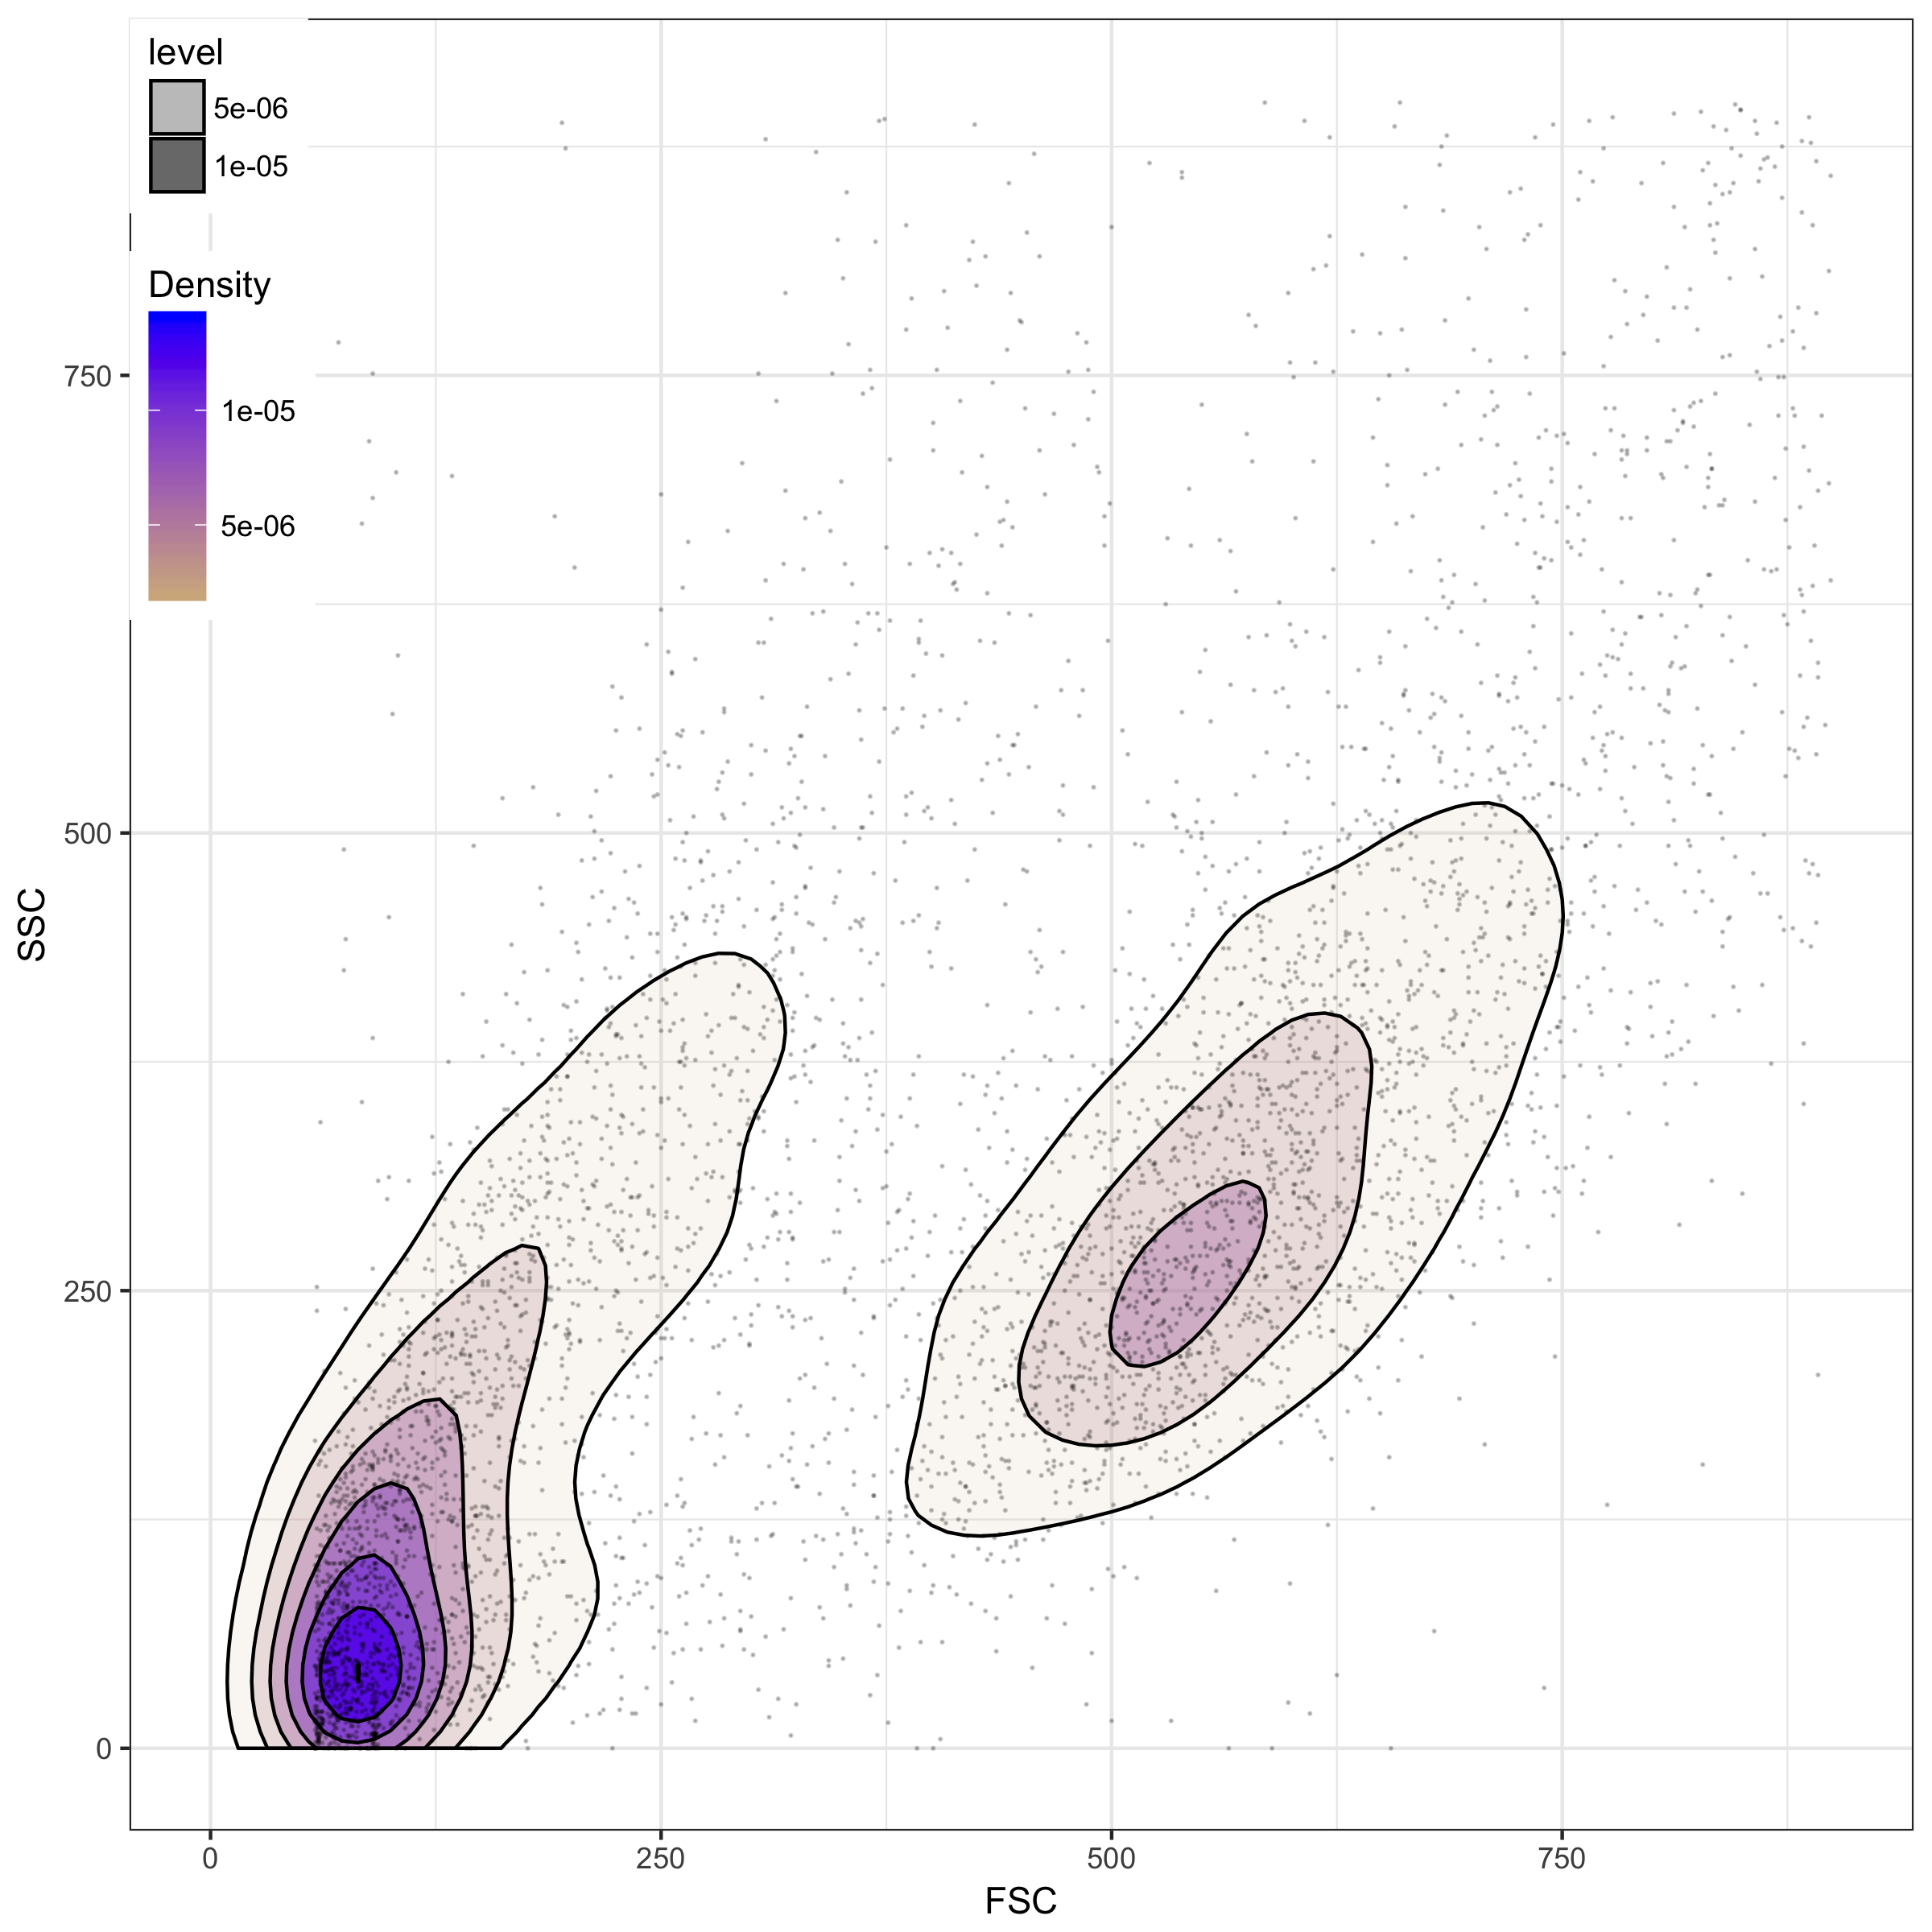
Skew multivariate distribution: contour plot
Flow cytometry data -- side scatter (SSC) and forward scatter (FSC)
Univariate skew-normal distribution
General skew-normal is denoted by $SN(\xi,\omega,\alpha)$
- $\xi$ and $\omega$ are the location and scale parameters
Simplest form: $z \sim SN(\alpha) $
- $\alpha$ is the skewness parameter
Range of univariate skew-normal distributions
Comparing $SN(\alpha)$ to a standard Normal
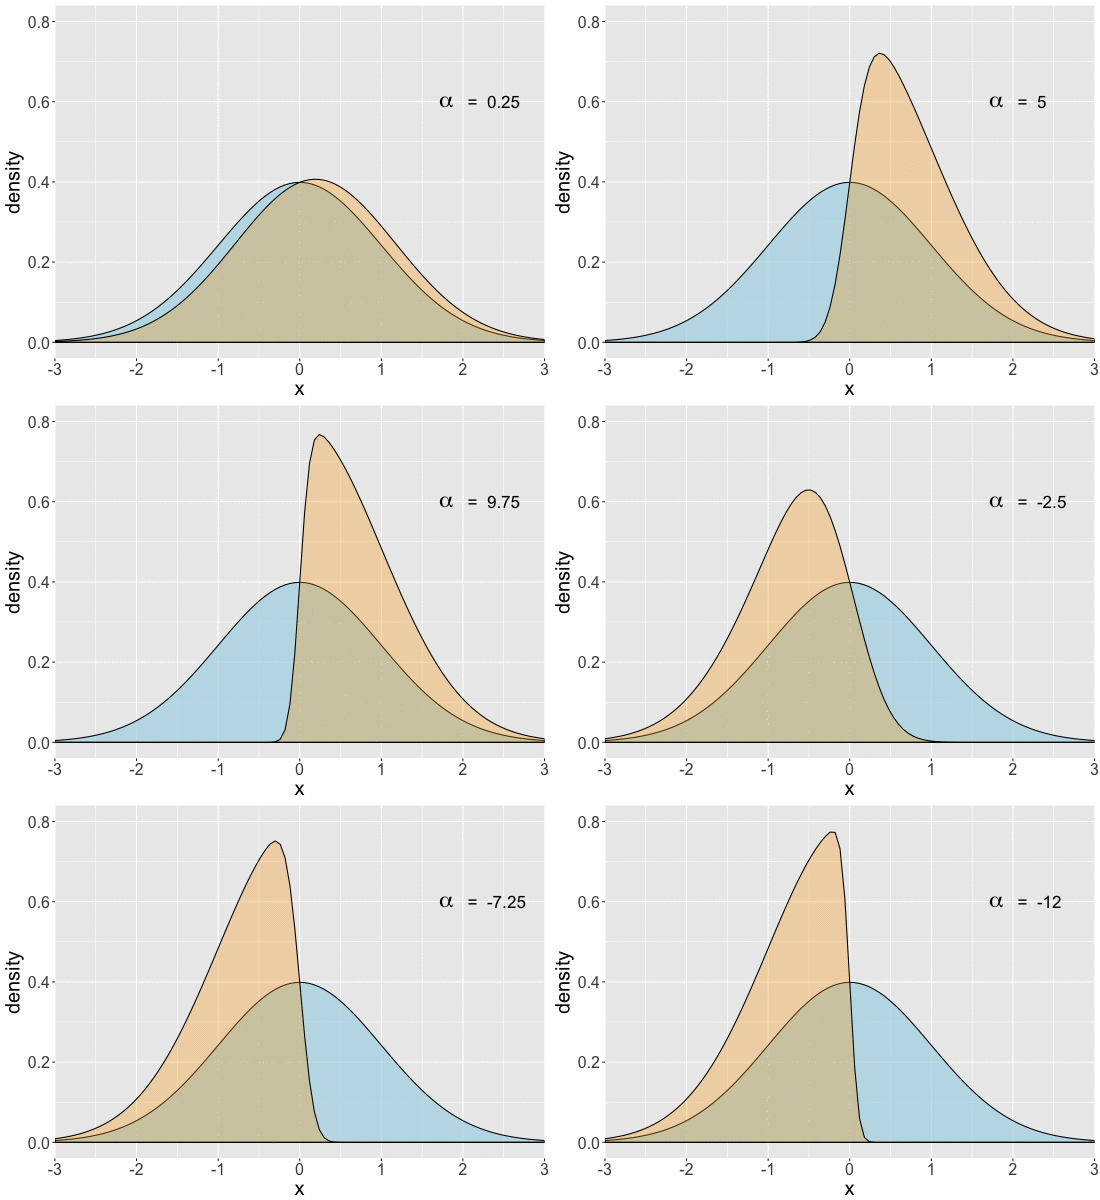
- For $\alpha>0$ skewed to the right
- For $\alpha<0$ skewed to the left
- $SN(0)$ is the same as a standard Normal
Multivariate skew-normal distribution
Notations: three-dimensional multivariate skew-normal distribution
$SN(\xi,\Omega,\alpha)$
- $\xi$ location parameter (vector of length $3$)
- $\Omega$ variance-covariance parameter ($3 \times 3$ matrix)
- $\alpha$ skewness parameter (vector of length $3$)
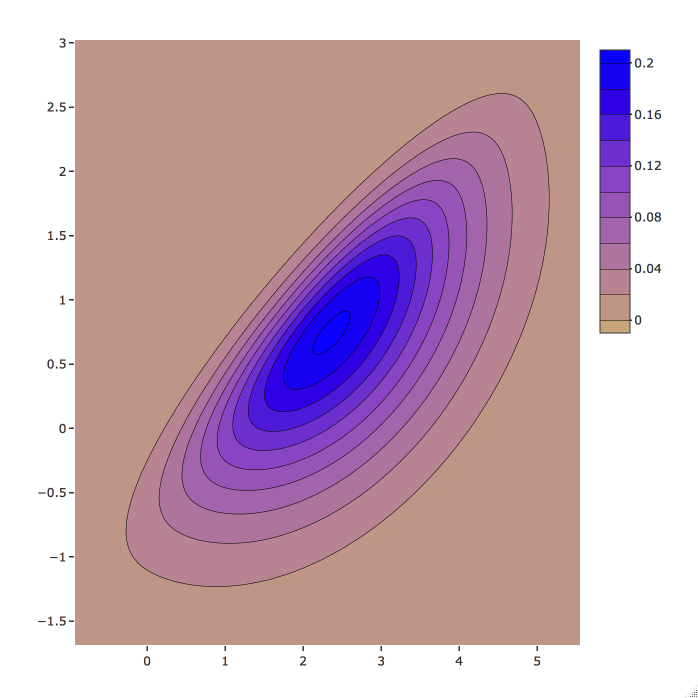
Bivariate skew-normal distribution contour plot
Bivariate skew-normal
${\xi}={\begin{pmatrix} 1 \\ 2 \end{pmatrix}},\quad { \Omega }={\begin{pmatrix} 1 & 0.5 \\ 0.5 & 2 \end{pmatrix}}$, ${\alpha}={\begin{pmatrix} -3 \\ 3 \end{pmatrix}}$.
Functions for skew-normal distribution
From sn library:
dmsn(x, xi, Omega, alpha)pmsn(x, xi, Omega, alpha)rmsn(n, xi, Omega, alpha)- Need to specify
xi,Omega,alpha
- Need to specify
Functions for skew-t distribution
From sn library:
dmst(x, xi, Omega, alpha, nu)pmst(x, xi, Omega, alpha, nu)rmst(n, xi, Omega, alpha, nu )- Need to specify
xi,Omega,alpha,nu(degrees of freedom)
- Need to specify
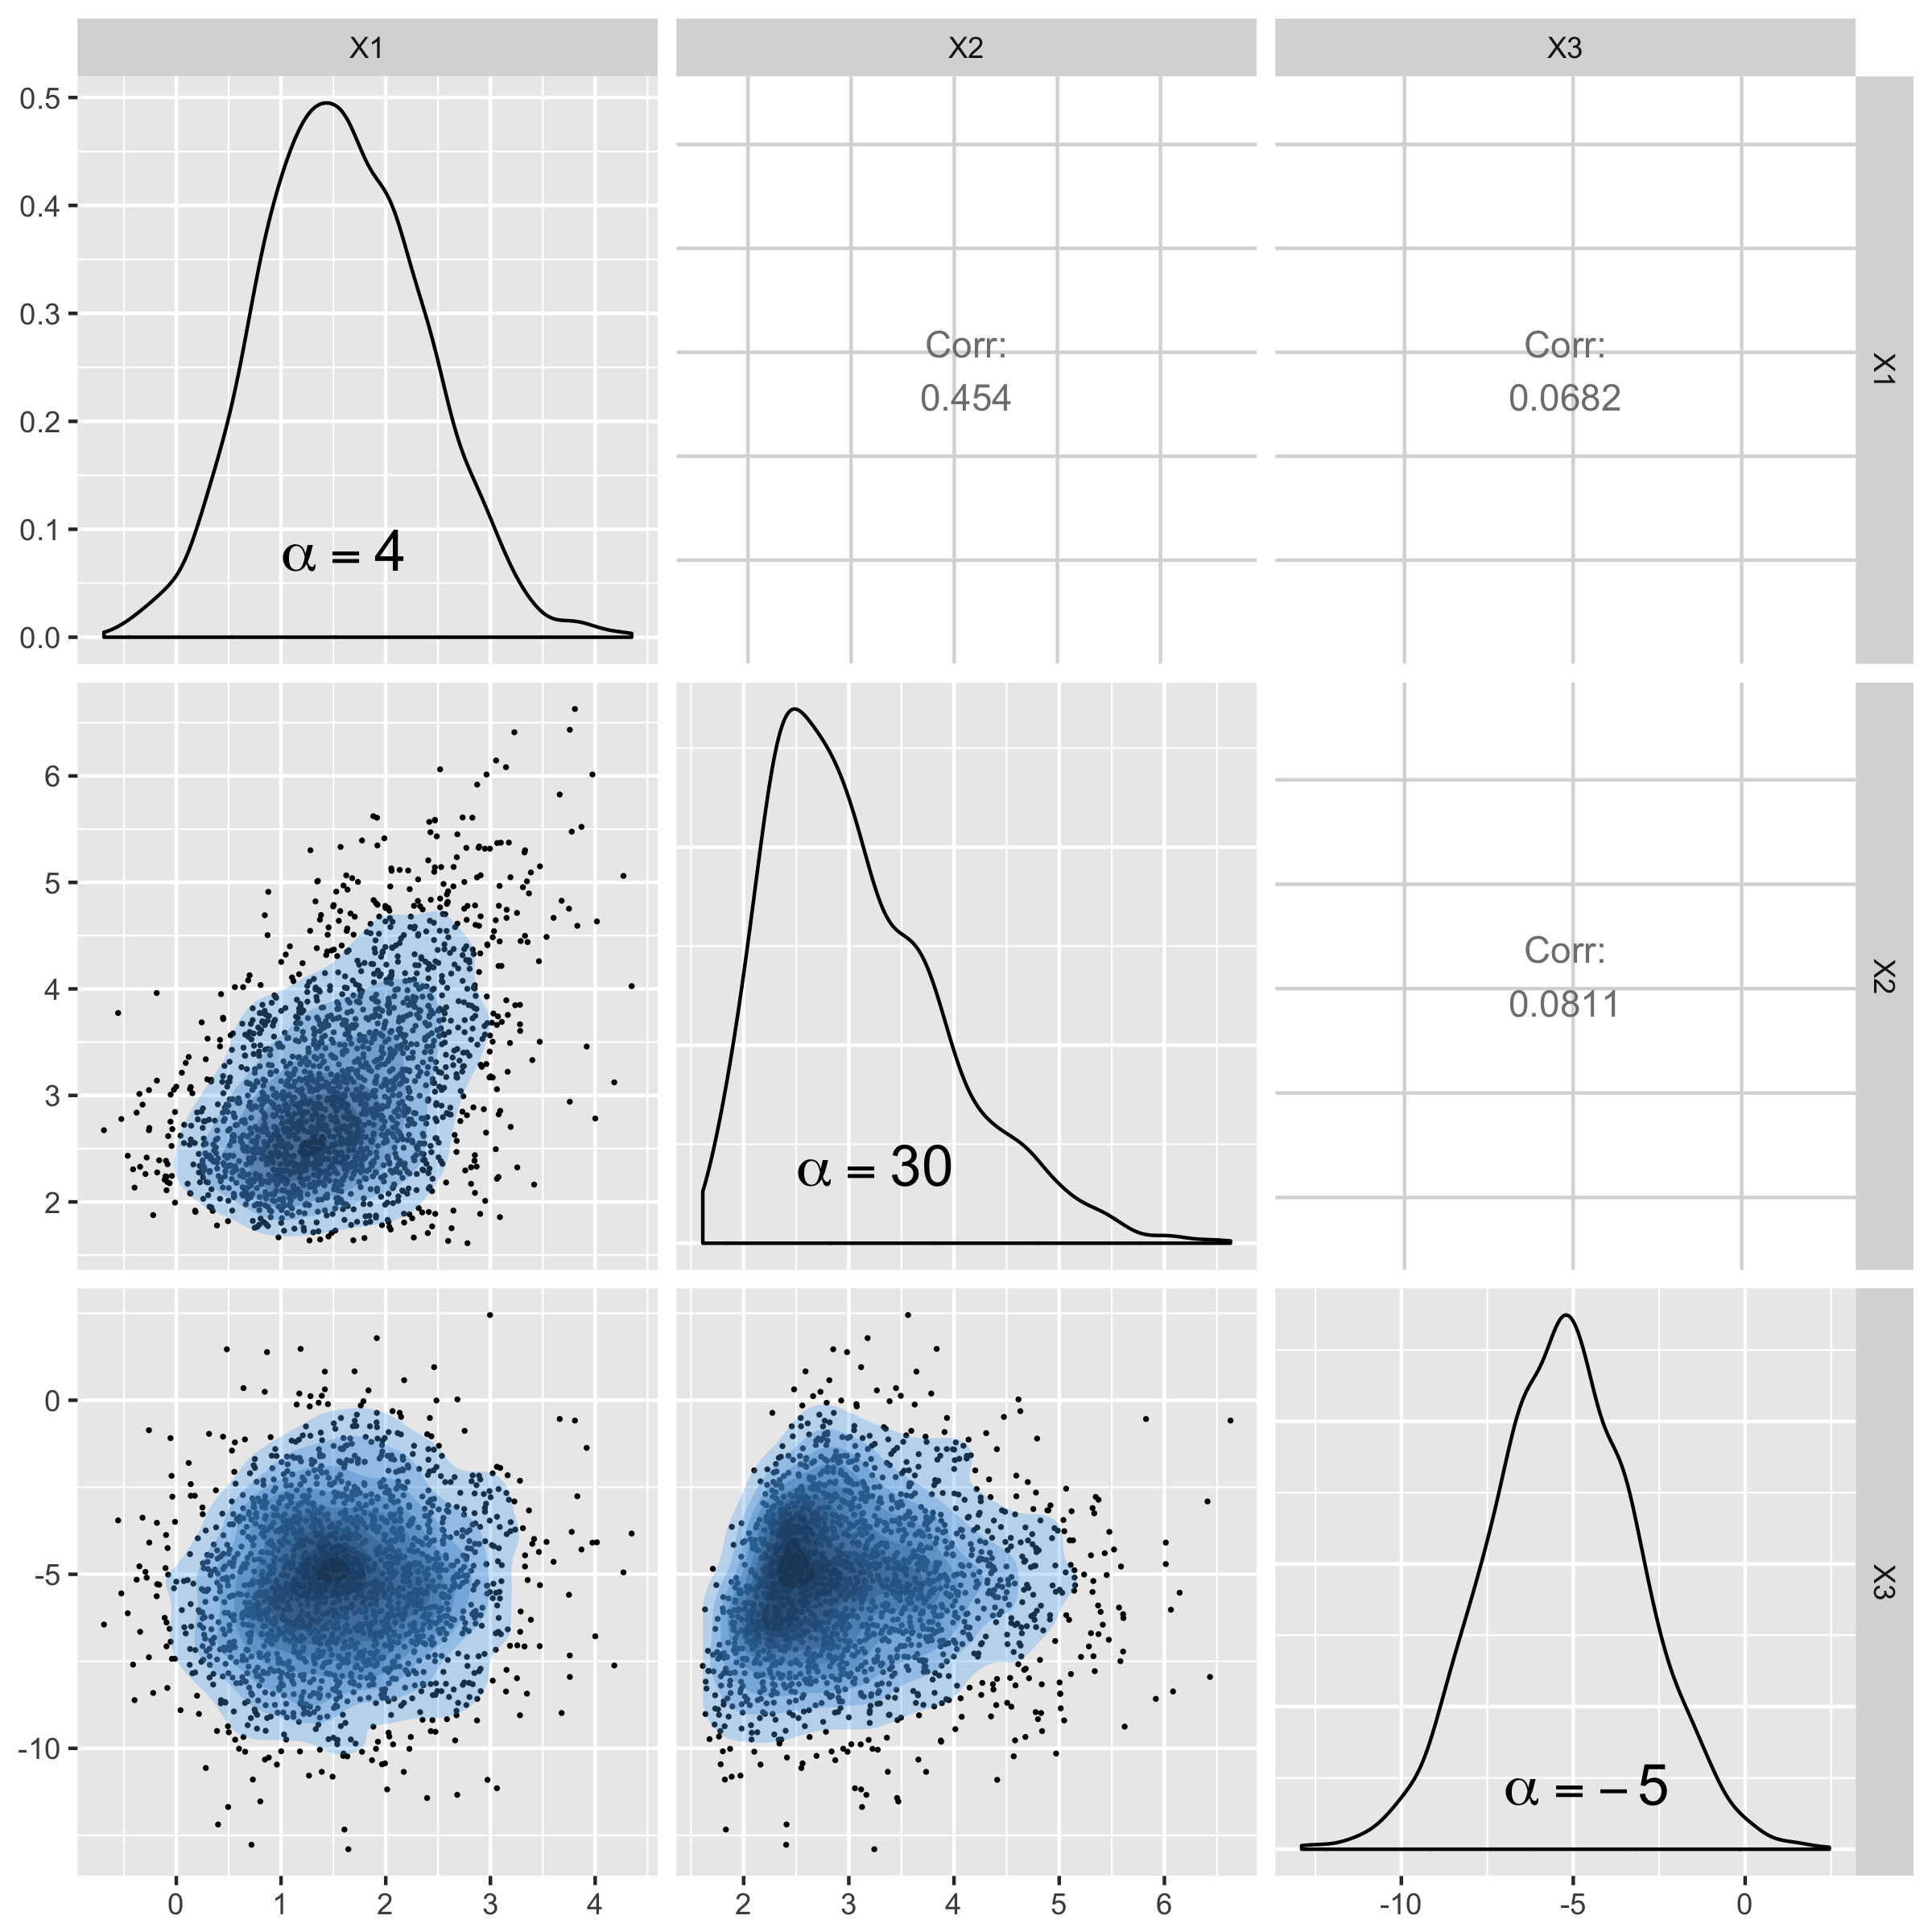
Generating skew-normal samples
Generate 2000 samples from 3 dimensional skew-normal
$ SN\left(\xi= \begin{pmatrix} 1 \\ 2 \\ -5 \end{pmatrix} , \Omega={\begin{pmatrix} 1 & 1 & 0 \\ 1 & 2 & 0 \\ 0 & 0 & 5 \end{pmatrix}}, \alpha=\begin{pmatrix} 4 \\ 30 \\ -5 \end{pmatrix} \right)$
# Specify xi, Omega and alpha
xi1 <- c(1, 2, -5)
Omega1 <- matrix(c(1, 1, 0,
                   1, 2, 0,
                   0, 0, 5), 3, 3)
alpha1 <- c(4, 30, -5)

# Generate samples
skew.sample <- rmsn(n = 2000, xi = xi1, Omega = Omega1, alpha = alpha1)
Sample from skew-normal distribution
Generating skew-t samples
Generate 2000 samples from 3 dimensional skew-t with
$\xi= \begin{pmatrix} 1 \\ 2 \\ -5 \end{pmatrix} , \Omega={\begin{pmatrix} 1 & 1 & 0 \\ 1 & 2 & 0 \\ 0 & 0 & 5 \end{pmatrix}}, \alpha=\begin{pmatrix} 4 \\ 30 \\ -5 \end{pmatrix}, df = 4$
# Generate samples
skewt.sample <- rmst(n = 2000, xi = xi1, Omega = Omega1, alpha = alpha1, nu = 4)
Estimation of parameters from data
Need iterative algorithm to estimate the parameters of a skew-normal distribution
- No explicit equation to calculate parameters
Several functions in
snpackage, includingmsn.mle()function
Estimation of parameters from data
msn.mle(y = skew.sample, opt.method = "BFGS")
$dp
$dp$beta
        X1    X2    X3
[1,] 1.024 2.021 -4.81

$dp$Omega
        X1      X2      X3
X1  0.9154  0.8865 -0.1507
X2  0.8865  1.8276 -0.3560
X3 -0.1507 -0.3560  5.0352

$dp$alpha
    X1     X2     X3
 3.670 28.465 -5.029
Samples were generated using:
$\xi= \begin{pmatrix} 1 \\ 2 \\ -5 \end{pmatrix} , \Omega={\begin{pmatrix} 1 & 1 & 0 \\ 1 & 2 & 0 \\ 0 & 0 & 5 \end{pmatrix}}, \alpha=\begin{pmatrix} 4 \\ 30 \\ -5 \end{pmatrix} $
Now let's do some exercises with skew-normal distributions!
Multivariate Probability Distributions in R

