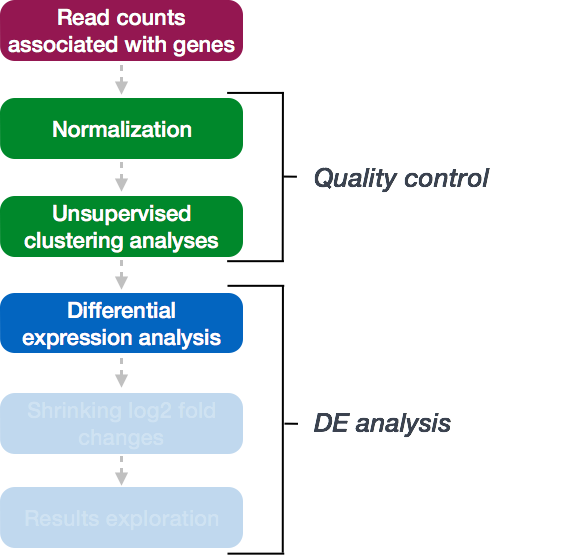
RNA-Seq DE analysis summary 2
RNA-Seq with Bioconductor in R

Mary Piper
Bioinformatics Consultant and Trainer
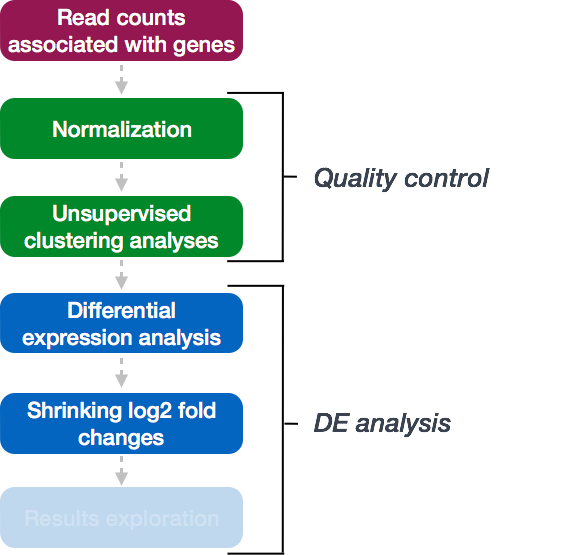
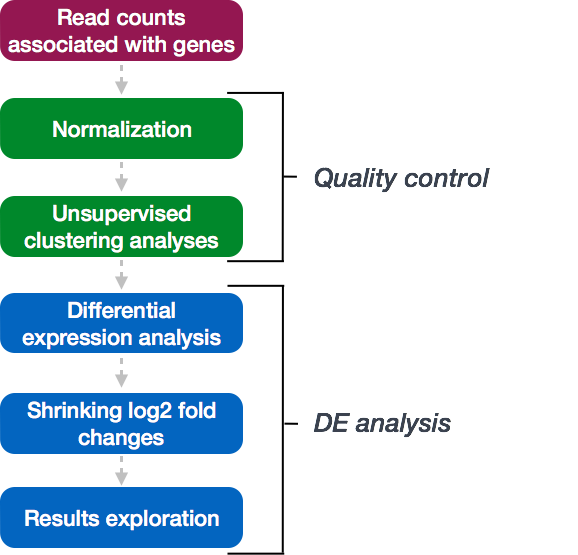
DESeq workflow - normalization
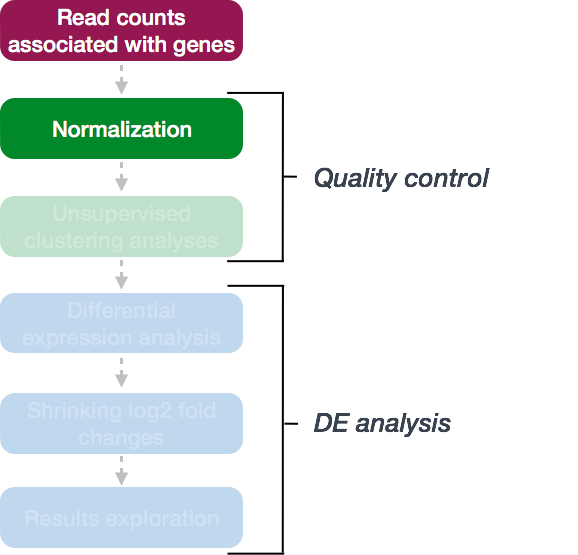
dds <- estimateSizeFactors(dds)
normalized_counts <- counts(dds, normalized=TRUE)
Unsupervised clustering analyses: log transformation
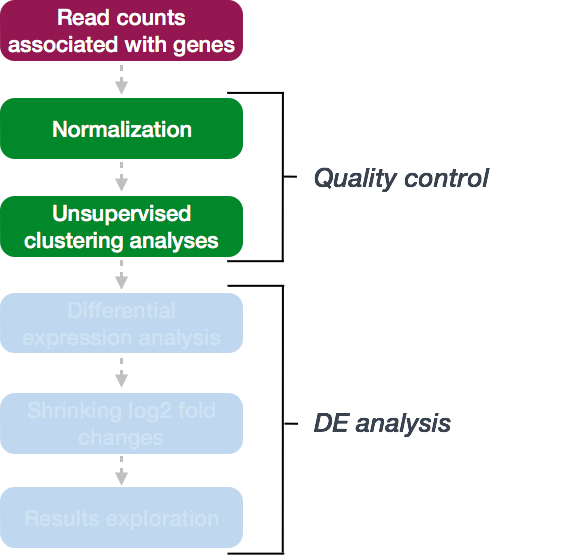
# Log transformation of normalized counts
vsd <- vst(dds, blind=TRUE)
Unsupervised clustering analyses
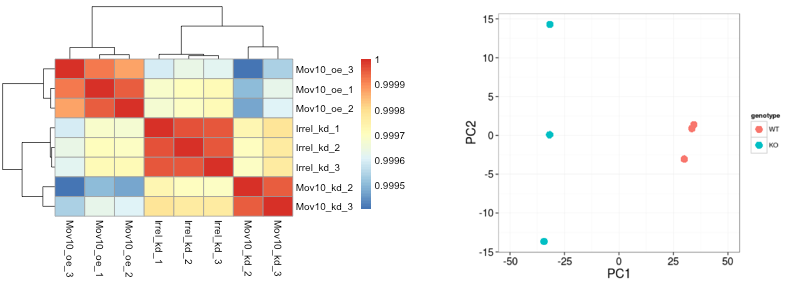
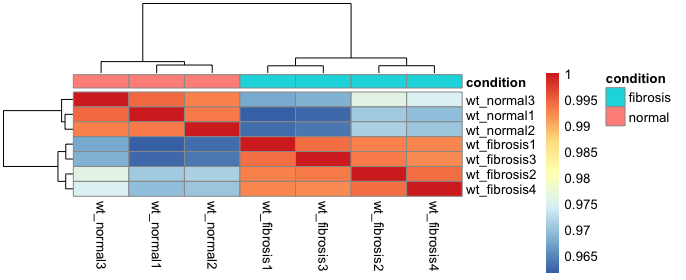
Unsupervised clustering analyses - heatmap
vsd %>%
    assay() %>% # Extract the vst matrix from the object
    cor() %>%   # Compute pairwise correlation values
    pheatmap(annotation = metadata[ , c("column_name1", "column_name2])
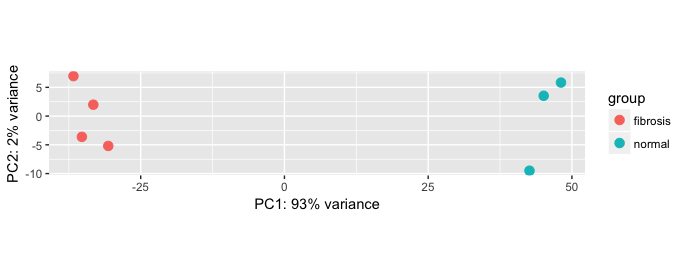
Unsupervised clustering analyses - pca
# PCA
plotPCA(vsd, intgroup="condition")
Running the DE analysis
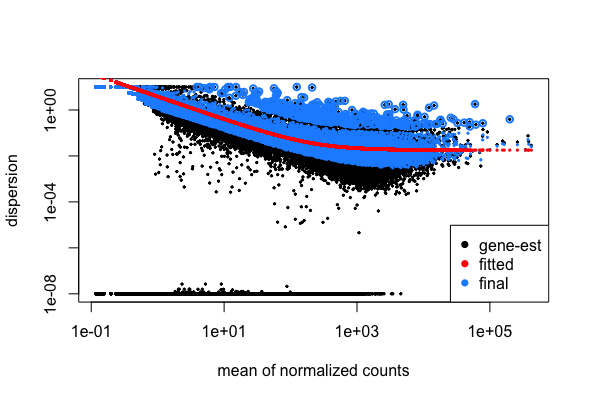
DESeq2 workflow - model
# Plot dispersion estimates
plotDispEsts(dds)
DESeq2 workflow - contrasts and LFC shrinkage
DESeq2 workflow - LFC shrinkage
# Extract all results as a data frame
res_all <- data.frame(res) %>%
        rownames_to_column(var = "ensgene")
# Add gene annotations
res_all <- left_join(x = res_all,
                    y = grcm38[, c("ensgene", "symbol", "description")],
                    by = "ensgene")
res_all <- arrange(res_all, padj)
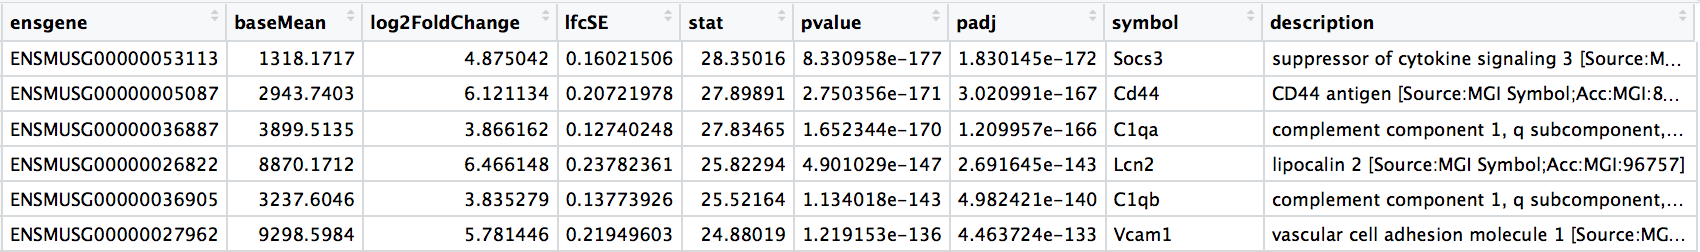
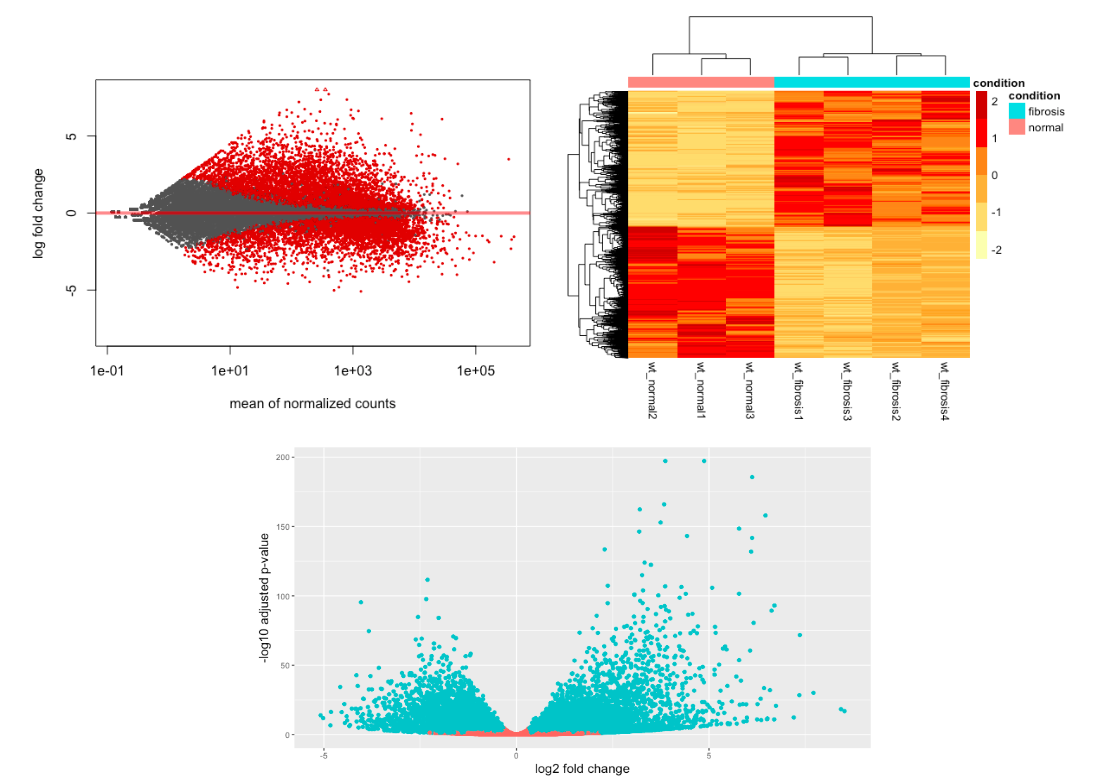
DESeq2 workflow - results exploration
DESeq2 workflow - results exploration
# Identify significant genes
res_sig <- subset(res_all, padj < 0.05)