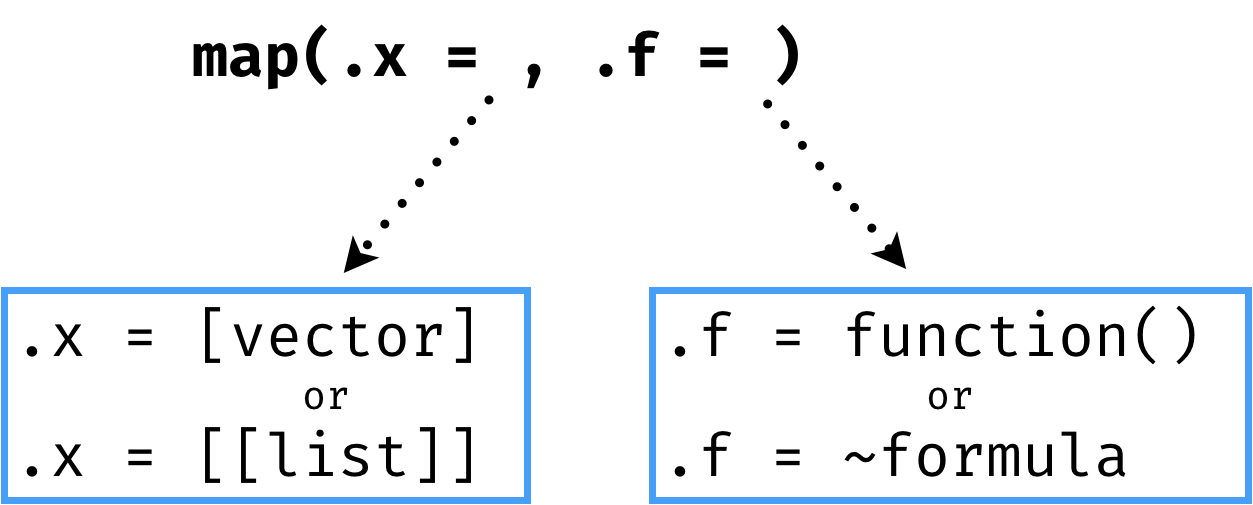
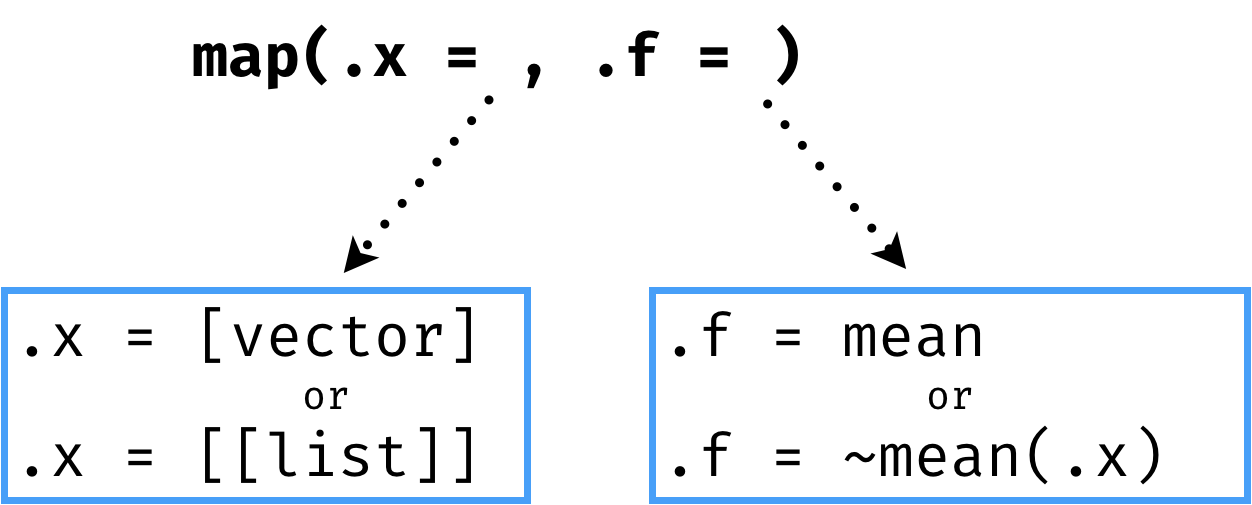
The map family of functions
Machine Learning in the Tidyverse

Dmitriy (Dima) Gorenshteyn
Lead Data Scientist, Memorial Sloan Kettering Cancer Center
List Column Workflow

List Column Workflow

The map Function

The map Function

The map Function

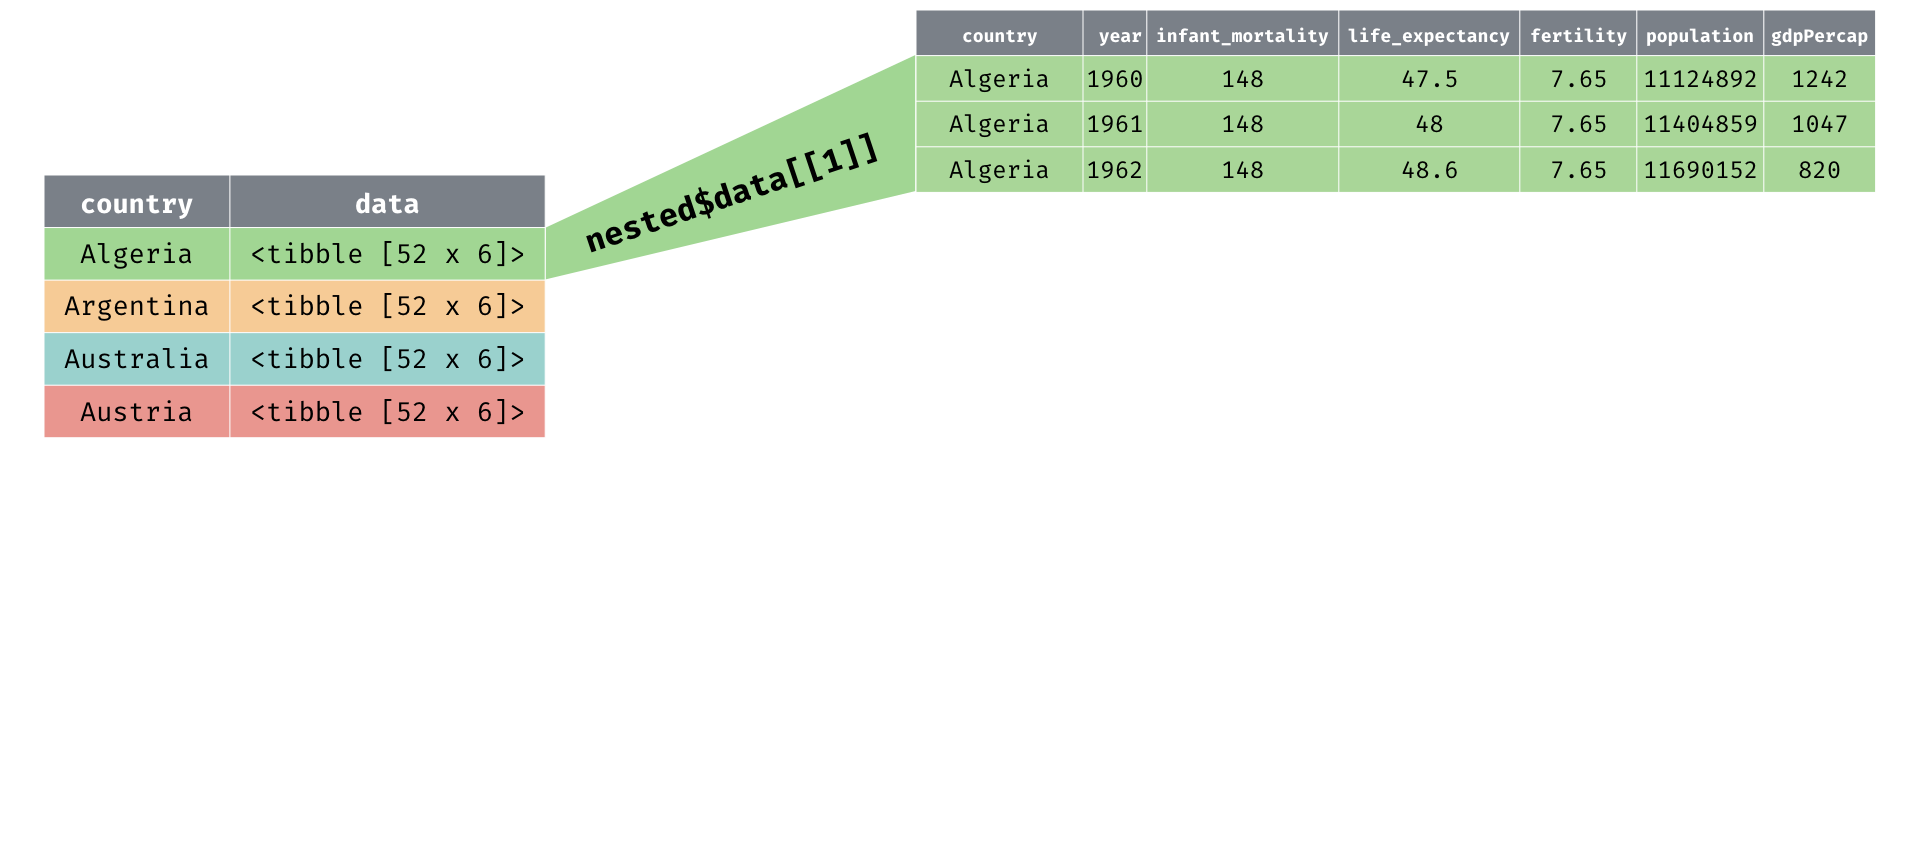
Population Mean by Country

mean(nested$data[[1]]$population)
[1] 23129438
Population Mean by Country
map(.x = nested$data, .f = ~mean(.x$population))
[[1]]
[1] 23129438

[[2]]
[1] 30783053

[[3]]
[1] 16074837

[[4]]
[1] 7746272
2: Work with List Columns - map() and mutate()
pop_df <- nested %>% mutate(pop_mean = map(data, ~mean(.x$population)))pop_df
# A tibble: 77 x 3
   country    data              pop_mean
   <fct>      <list>            <list>
 1 Algeria    <tibble [52 × 6]> <dbl [1]>
 2 Argentina  <tibble [52 × 6]> <dbl [1]>
 3 Australia  <tibble [52 × 6]> <dbl [1]>
 4 Austria    <tibble [52 × 6]> <dbl [1]>
 5 Bangladesh <tibble [52 × 6]> <dbl [1]>
3: Simplify List Columns - unnest()
pop_df %>%
  unnest(pop_mean)
# A tibble: 77 x 3
   country    data               pop_mean
   <fct>      <list>                <dbl>
 1 Algeria    <tibble [52 × 6]>  23129438
 2 Argentina  <tibble [52 × 6]>  30783053
 3 Australia  <tibble [52 × 6]>  16074837
 4 Austria    <tibble [52 × 6]>   7746272
 5 Bangladesh <tibble [52 × 6]>  97649407
List Column Workflow

Work With + Simplify List Columns With map_*()
| function | returns |
|---|---|
| map() | list |
| map_dbl() | double |
| map_lgl() | logical |
| map_chr() | character |
| map_int() | integer |
Work With + Simplify List Columns With map_dbl()
nested %>%
  mutate(pop_mean = map_dbl(data, ~mean(.x$population)))
# A tibble: 77 x 3
   country    data               pop_mean
   <fct>      <list>                <dbl>
 1 Algeria    <tibble [52 × 6]>  23129438
 2 Argentina  <tibble [52 × 6]>  30783053
 3 Australia  <tibble [52 × 6]>  16074837
 4 Austria    <tibble [52 × 6]>   7746272
 5 Bangladesh <tibble [52 × 6]>  97649407
Build Models with map()
nested %>%
   mutate(model = map(data, ~lm(formula = population~fertility,
             data = .x)))
# A tibble: 77 x 3
   country    data              model
   <fct>      <list>            <list>
 1 Algeria    <tibble [52 × 6]> <S3: lm>
 2 Argentina  <tibble [52 × 6]> <S3: lm>
 3 Australia  <tibble [52 × 6]> <S3: lm>
 4 Austria    <tibble [52 × 6]> <S3: lm>
 5 Bangladesh <tibble [52 × 6]> <S3: lm>
Let's map something!
Machine Learning in the Tidyverse

